Random Vertex Relabelling in LaganLighter

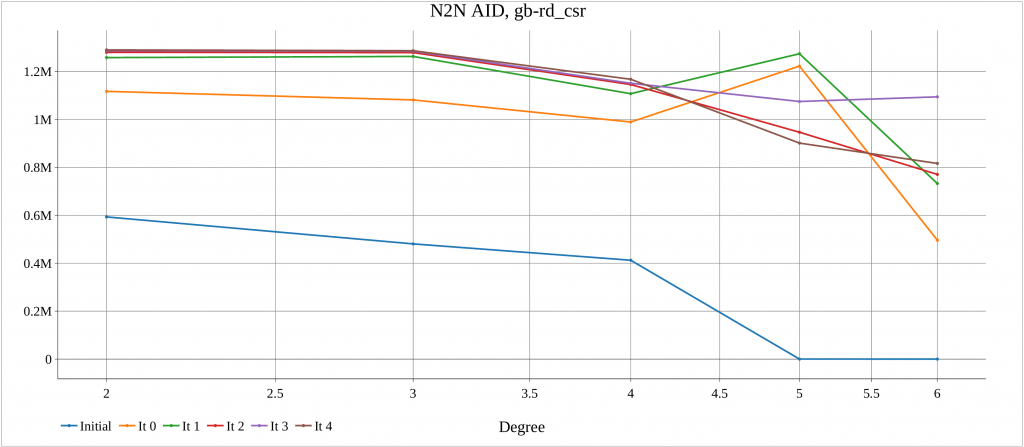
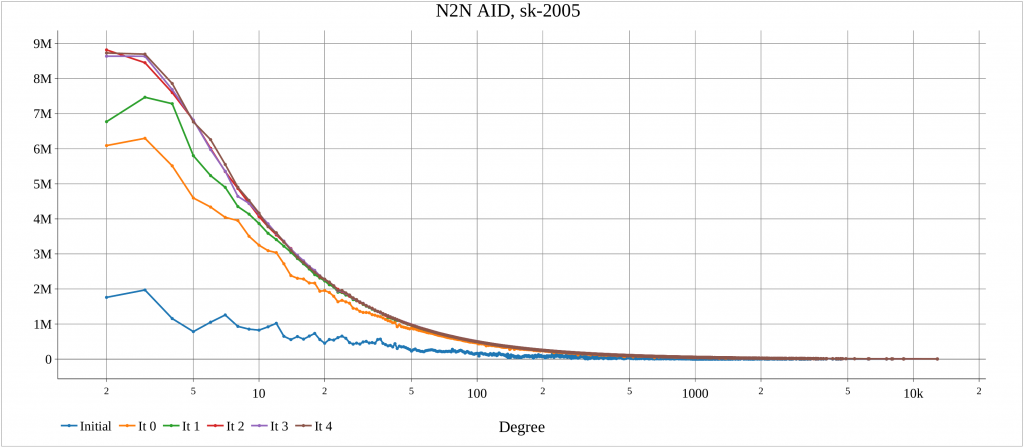
To evaluate the impacts of locality-optimizing reordering algorithms, a baseline is required. To create the baseline a random assignment of IDs to vertices may be used to produce a representation of the graph with reduced locality [ DOI:10.1109/ISPASS57527.2023.00029, DOI:10.1109/IISWC53511.2021.00020 ].

To that end, we create the random_ordering() function in relabel.c file. It consists a number of iterations. In each iteration, concurrent threads traverse the list of vertices and assign them new IDs. The function uses xoshiro to produce random numbers.

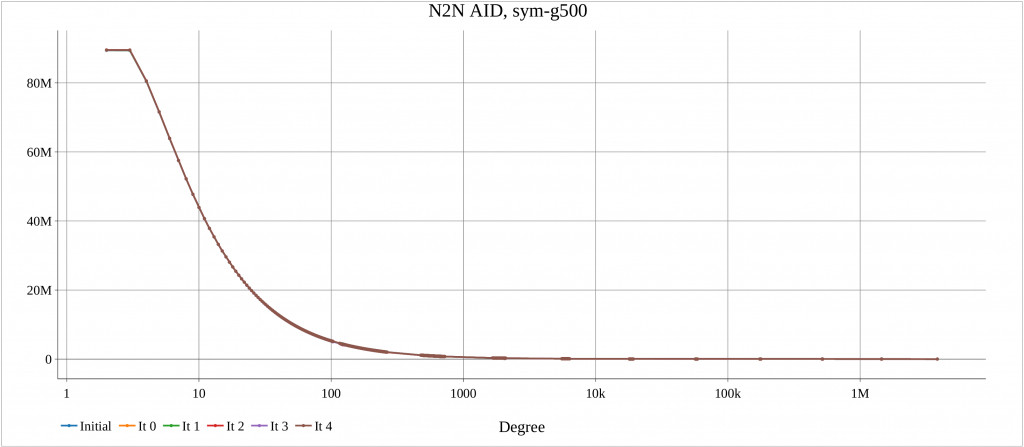
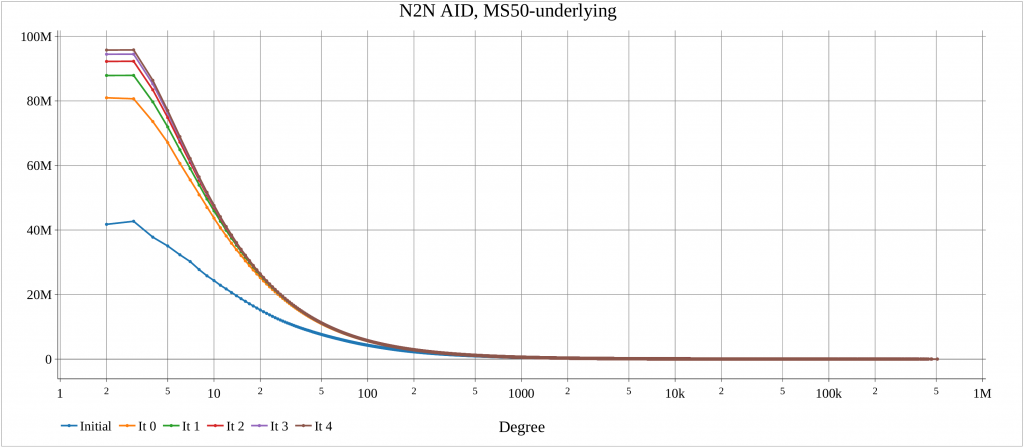
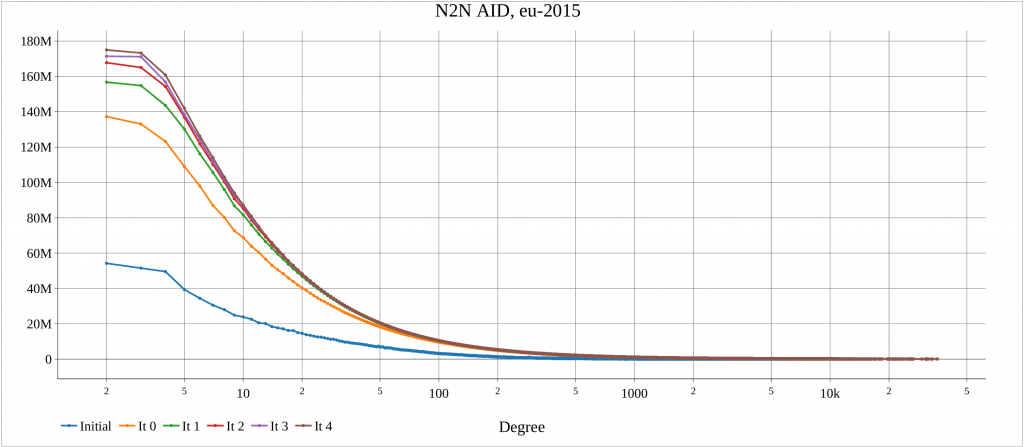
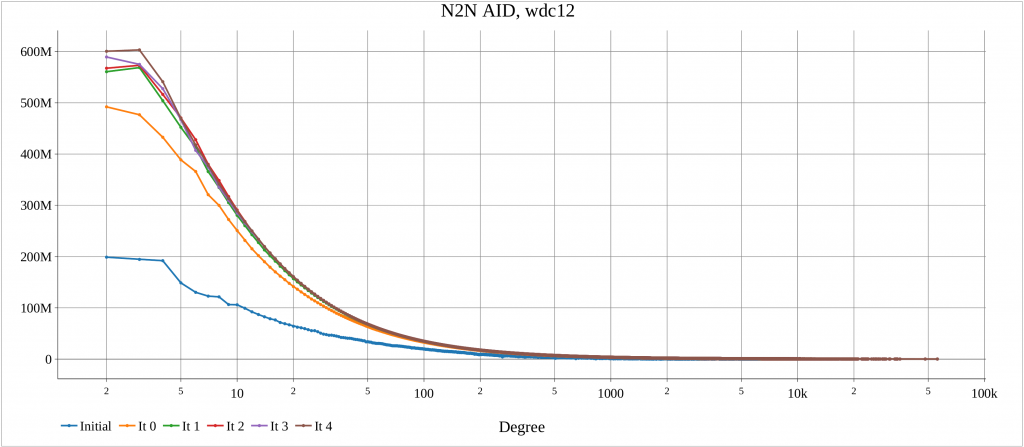
The alg4_randomize tests this function for a number of graphs. For each dataset, an initial plot of degree distribution of Neighbor to Neighbor Average ID Distance (N2N AID) [DOI:10.1109/IISWC53511.2021.00020] is created. Also, after each iteration of random_ordering() the N2N AID distribution is plotted. This shows the impacts of randomization.

The complete results for all graphs can be seen in this PDF file. The results for some graphs are in the following.

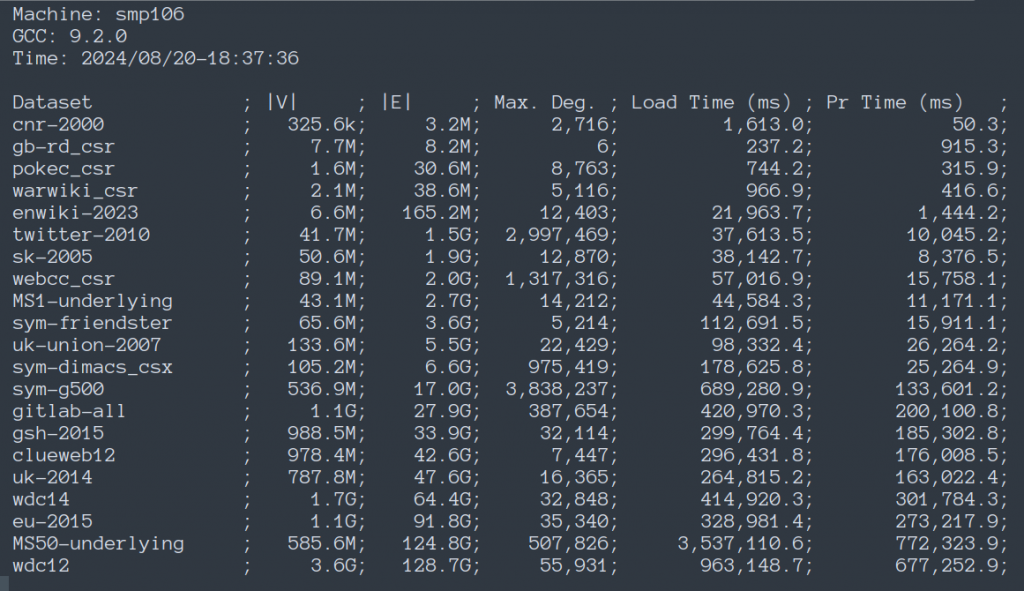
The algorithm has been executed on a machine with two AMD 7401 CPUs, 128 cores, 128 threads. The report created by the launcher is in the following.

Technical Posts


LaganLighter

Minimum Spanning Forest of MS-BioGraphs

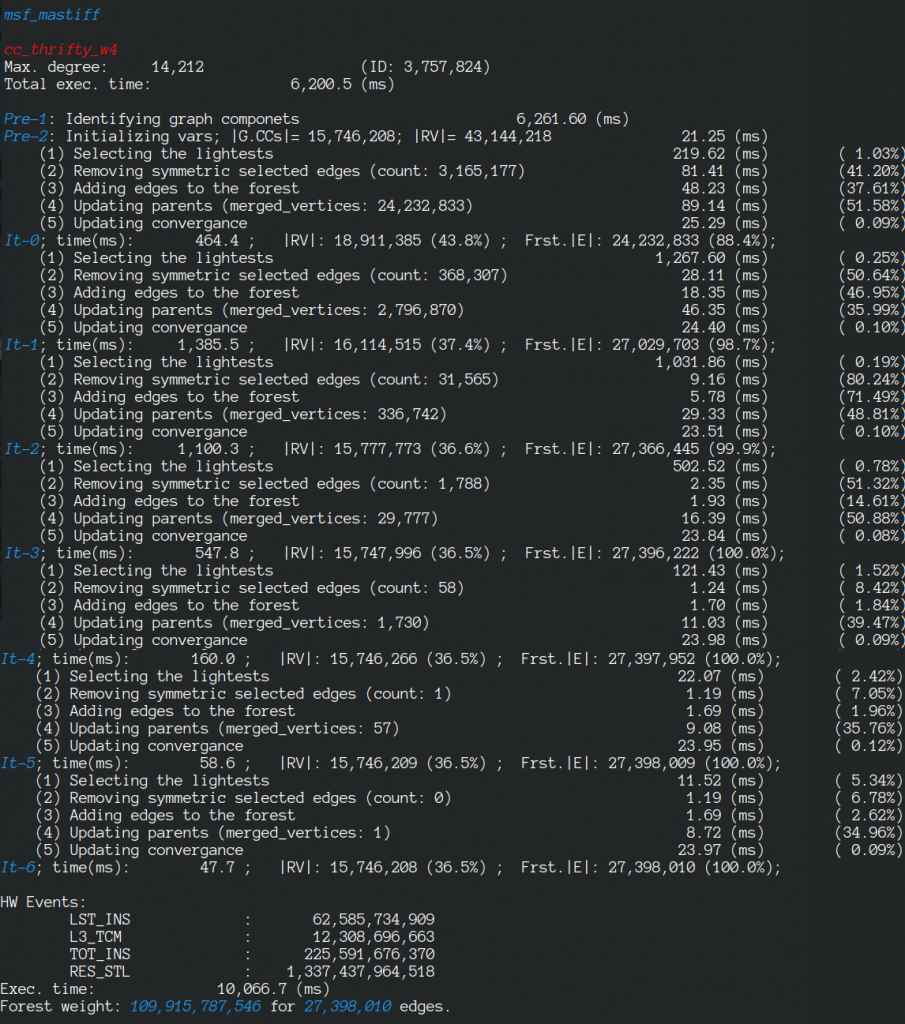
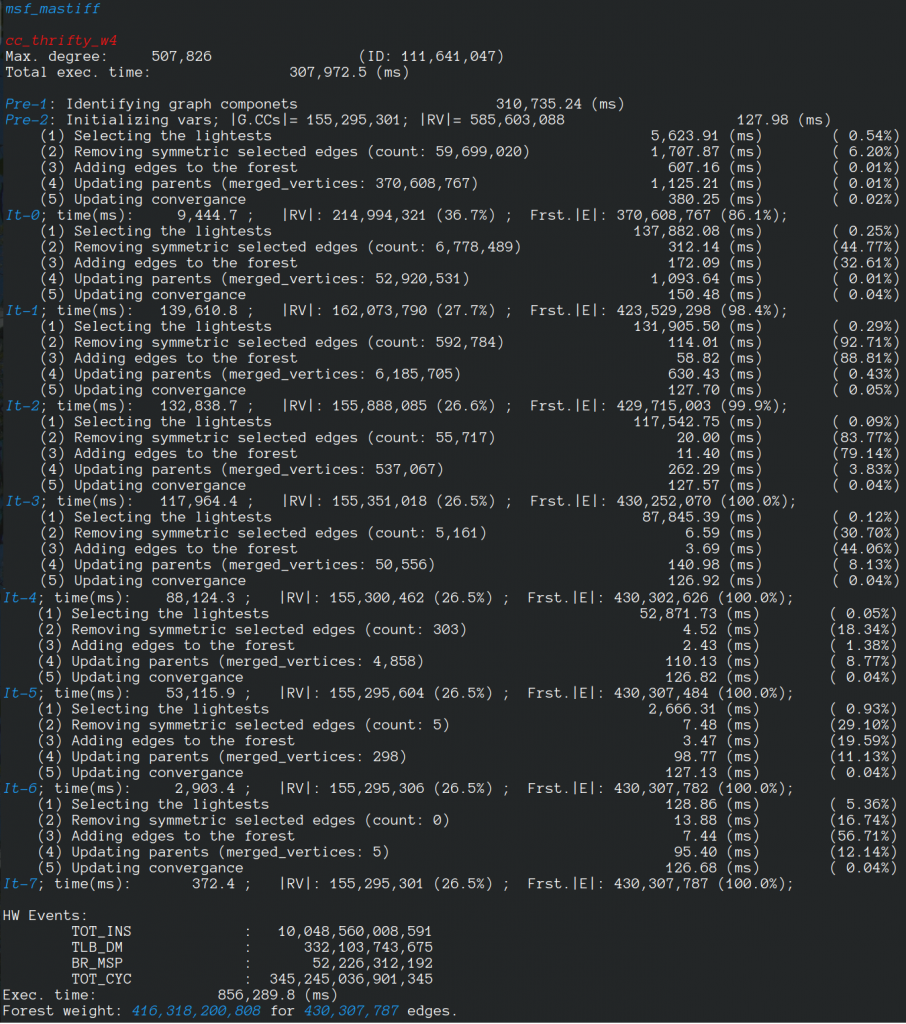
We use MASTIFF to compute the weight of Minimum Spanning Forest (MST) of MS-BioGraphs while ignoring self-edges of the graphs.

– MS1

Using machine with 24 cores.

MSF weight: 109,915,787,546

– MS50

Using machine with 128 cores.

MSF weight: 416,318,200,808

MS-BioGraphs
Related Posts

Technical Posts


LaganLighter

Topology-Based Thread Affinity Setting (Thread Pinning) in OpenMP

In applications such as graph processing, it is important how threads are pinned on CPU cores as the threads that share resources (such as memory and cache) can accelerate the performance by processing consecutive blocks of input dataset, especially, when the dataset has a high-level of locality.

In LaganLighter, we read the CPU topology to specify how OpenMP threads are pinned. In omp.c file, the block starting with comment “Reading sibling groups of each node“, reads the “/sys/devices/system/cpu/cpu*/topology/thread_siblings” files to identify the sibling threads and three arrays ("node_sibling_groups_start_ID“, “sibling_group_cpus_start_offsets“, and “sibling_groups_cpus“) are used to store the sibling CPUs.

Then, in block starting with comment “Setting affinity of threads“, the sibling groups are read and based on the total number of threads requested by user, a number of threads with consecutive IDs are pinned to sibling CPUs.

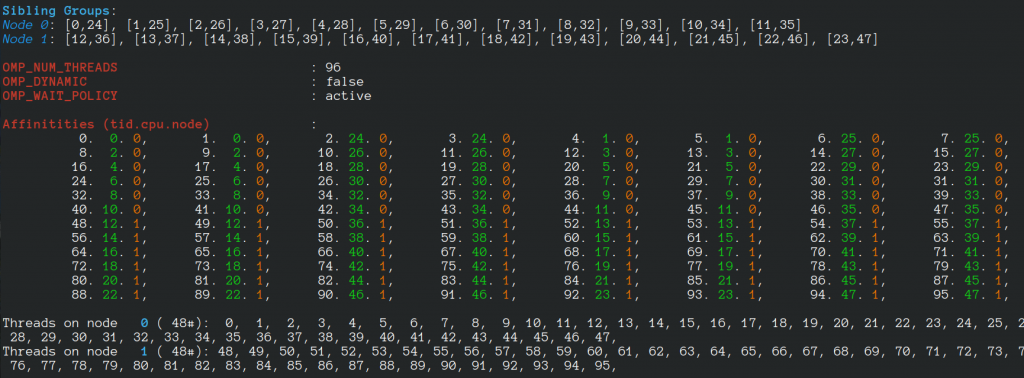
For a machine with 24 cores, 48 hyperthreads, when 48 threads are requested, we have:

If 96 threads are created, we have:

Technical Posts


LaganLighter

An (Incomplete) List of Publicly Available Graph Datasets/Generators

Short URL of this post: https://blogs.qub.ac.uk/DIPSA/graphs-list-2024

Real-World Graphs

Smaller Graphs

Synthetic Graph Generators

Technical Posts

Selective Parallel Loading of Large-Scale Compressed Graphs with ParaGrapher – arXiv Version

PDF version
DOI: 10.48550/arXiv.2404.19735

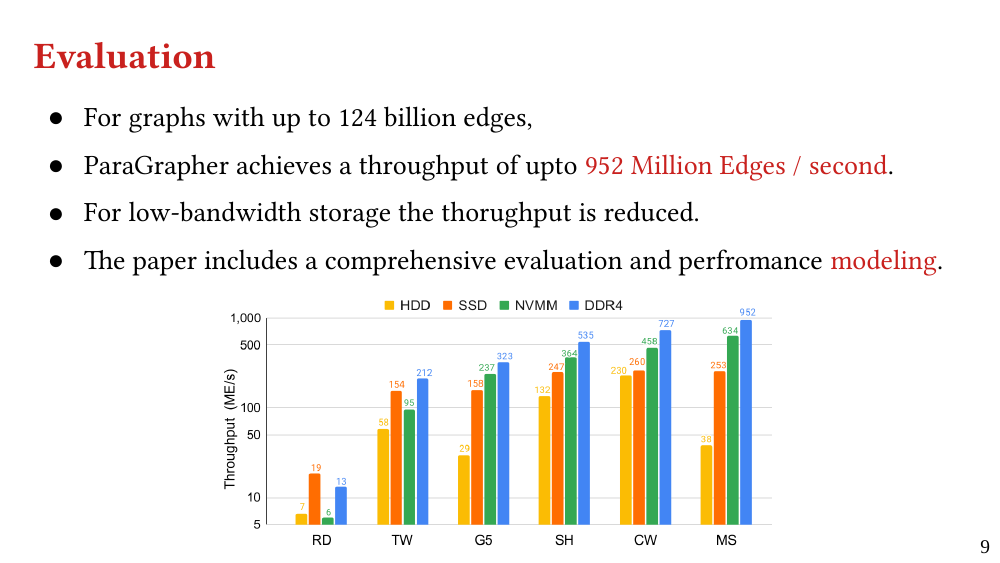
Comprehensive evaluation is one of the basis of experimental science. In High-Performance Graph Processing, a thorough evaluation of contributions becomes more achievable by supporting common input formats over different frameworks. However, each framework creates its specific format, which may not support reading large-scale real-world graph datasets. This shows a demand for high-performance libraries capable of loading graphs to (i) accelerate designing new graph algorithms, (ii) to evaluate the contributions on a wide range of graph algorithms, and (iii) to facilitate easy and fast comparison over different graph frameworks.

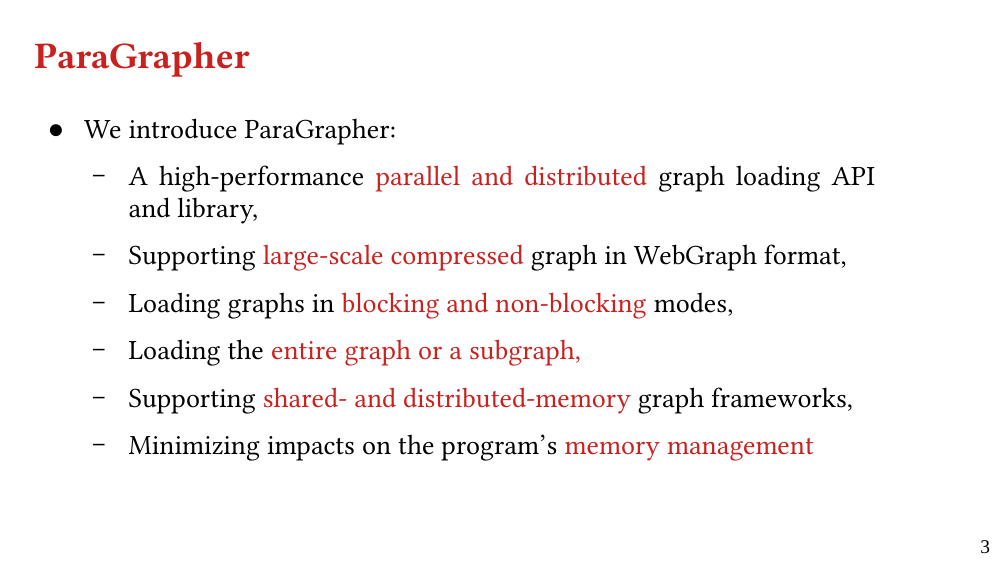
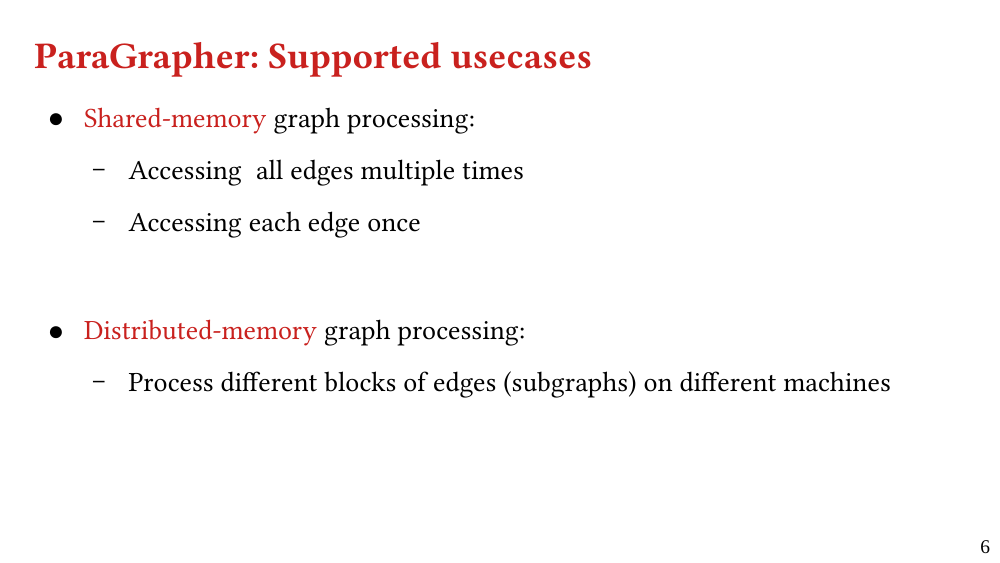
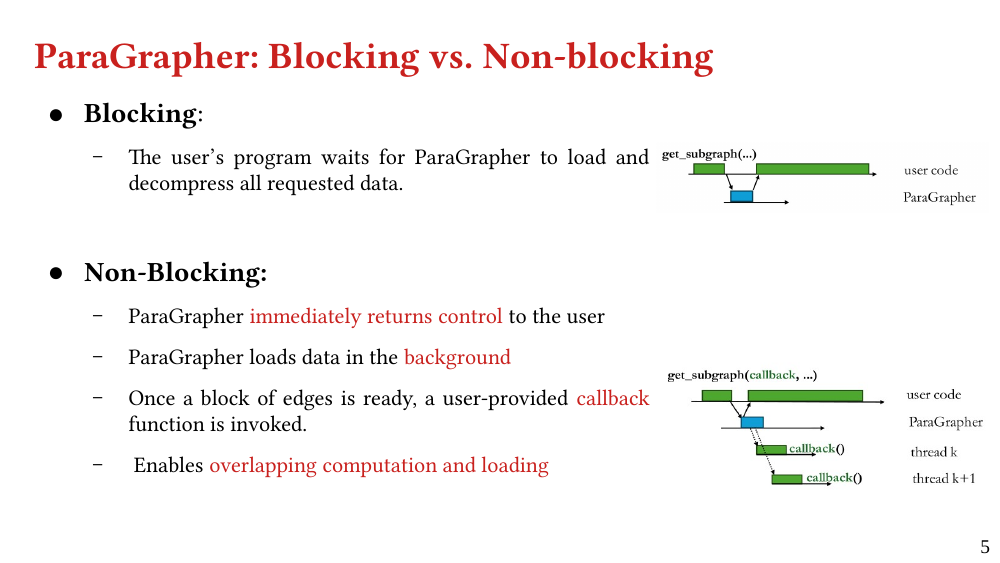
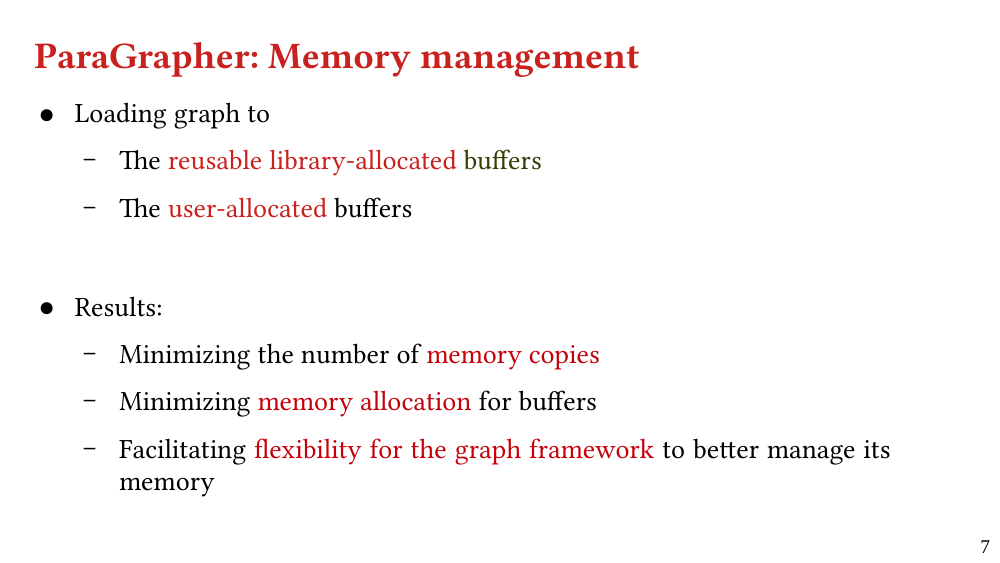
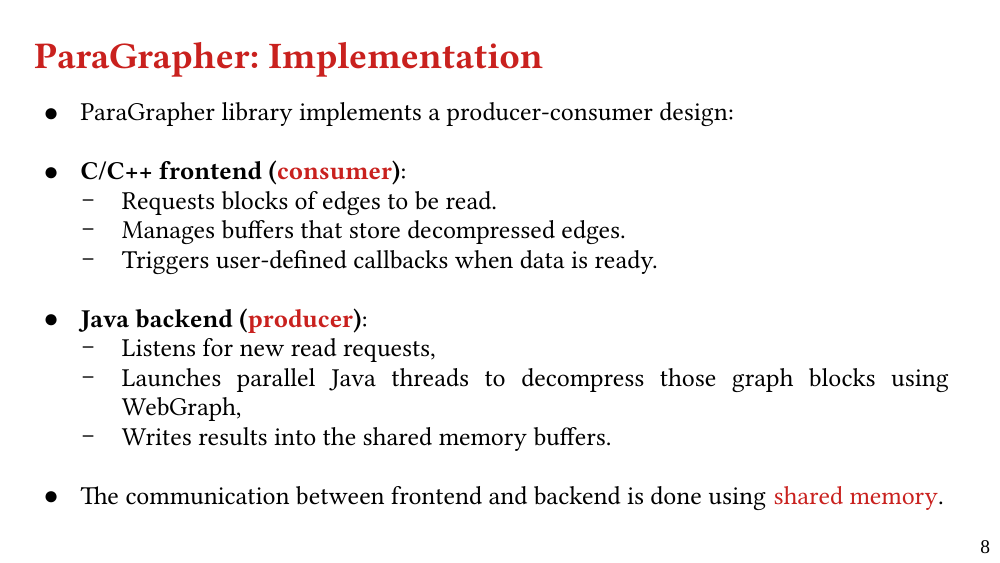
To that end, we present ParaGrapher, a high-performance API and library for loading large-scale and compressed graphs. ParaGrapher supports different types of requests for accessing graphs in shared- and distributed-memory and out-of-core graph processing. We explain the design of ParaGrapher and present a performance model of graph decompression, which is used for evaluation of ParaGrapher over three storage types.
Our evaluation shows that by decompressing compressed graphs in WebGraph format, ParaGrapher delivers up to 3.2 times speedup in loading and up to 5.2 times speedup in end-to-end execution in comparison to the binary and textual formats.

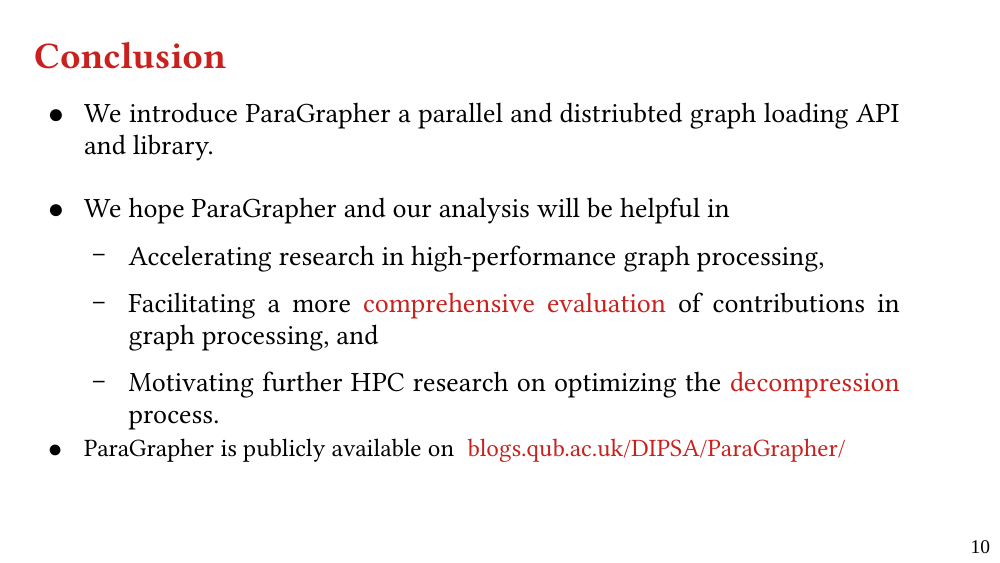
ParaGrapher is available online on https://blogs.qub.ac.uk/DIPSA/ParaGrapher/.

BibTex

@misc{paragrapher-arxiv,
  title = { Selective Parallel Loading of Large-Scale 
            Compressed Graphs with ParaGrapher}, 
  author = { {Mohsen} {Koohi Esfahani} and Marco D'Antonio and 
             Syed Ibtisam Tauhidi and Thai Son Mai and 
             Hans Vandierendonck},
  year = {2024},
  eprint = {2404.19735},
  archivePrefix = {arXiv},
  primaryClass = {cs.AR},
  doi = {10.48550/arXiv.2404.19735}
}

Related Posts & Source Code

ParaGrapher Web Page

MS-BioGraphs on IEEE DataPort

MS-BioGraph sequence similarity graph datasets are now publicly available on IEEE DataPort: https://doi.org/10.21227/gmd9-1534.

To access the files, you need to register/login to IEEE DataPort and then visit the MS-BioGraphs page. By saving the page as an HTML file such as dp.html, you may download the datasets (as an example MS1) using the following script:

dsname="MS1"
html_file="dp.html"

urls=`cat $html_file  | sed  -e 's/\&/\&/g'  | grep -Eo "(http|https)://[a-zA-Z0-9./?&=_%:-]*" | grep amazonaws  | sort | uniq | grep -E "$dsname[-_\.]"`

for u in $urls; do
    wget $u
    if [ $? != 0 ]; then break; fi
done

# removing query strings
for f in $(find $1 -type f); do
    if [ $f = ${f%%\?*} ]; then continue; fi
    mv "${f}" "${f%%\?*}"
done

# liking offsets.bin to be found by ParaGrapher
ln -s ${dsname}_offsets.bin ${dsname}-underlying_offsets.bin

Instead of wget you may use axel -n 10 to use multiple connections (here, 10) for downloading each file (https://manpages.ubuntu.com/manpages/noble/en/man1/axel.1.html).

MS-BioGraphs

Related Posts

Dataset Announcement: MS-BioGraphs, Trillion-Scale Public Real-World Sequence Similarity Graphs – IISWC’23 (Poster)

2023 IEEE International Symposium on Workload Characterization (IISWC’23)
October 1-3, 2023, Ghent, Belgium

DOI: 10.1109/IISWC59245.2023.00029
PDF Version

Progress in High-Performance Computing in general, and High-Performance Graph Processing in particular, is highly dependent on the availability of publicly-accessible, relevant, and realistic data sets.

In this paper, we announce publication of MS-BioGraphs, a new family of publicly-available real-world edge-weighted graph datasets with up to 2.5 trillion edges, that is, 6.6 times greater than the largest graph published recently.

We briefly review the two main challenges we faced in generating large graph datasets and our solutions, that are, (i) optimizing data structures and algorithms for this multi-step process and (ii) WebGraph parallel compression technique. We also study some characteristics of MS-BioGraphs.

The datasets are available on https://blogs.qub.ac.uk/DIPSA/MS-BioGraphs .

Please visit https://blogs.qub.ac.uk/DIPSA/MS-BioGraphs-Sequence-Similarity-Graph-Datasets/ for a complete version of this paper.

Bibtex

@INPROCEEDINGS{10.1109/IISWC59245.2023.00029,
   author = {Koohi Esfahani, Mohsen and Boldi, Paolo and Vandierendonck, Hans and Kilpatrick,  Peter and  Vigna, Sebastiano},  
  booktitle={2023 IEEE International Symposium on Workload Characterization (IISWC'23)},  
  title={Dataset Announcement: {MS-BioGraphs}, Trillion-Scale Public Real-World Sequence Similarity Graphs}, 
  year={2023},
  volume={},
  number={},
  pages={},
  location={Belgium, Ghent},
  publisher={IEEE Computer Society},
  doi={10.1109/IISWC59245.2023.00029}
}

MS-BioGraphs

Related Posts

MS-BioGraphs: Sequence Similarity Graph Datasets

DOI: 10.48550/arXiv.2308.16744

PDF Version
arXiv Link

Progress in High-Performance Computing in general, and High-Performance Graph Processing in particular, is highly dependent on the availability of publicly-accessible, relevant, and realistic data sets.

To ensure continuation of this progress, we (i) investigate and optimize the process of generating large sequence similarity graphs as an HPC challenge and (ii) demonstrate this process in creating MS-BioGraphs, a new family of publicly available real-world edge-weighted graph datasets with up to 2.5 trillion edges, that is, 6.6 times greater than the largest graph published recently. The largest graph is created by matching (i.e., all-to-all similarity aligning) 1.7 billion protein sequences. The MS-BioGraphs family includes also seven subgraphs with different sizes and direction types.

We describe two main challenges we faced in generating large graph datasets and our solutions, that are, (i) optimizing data structures and algorithms for this multi-step process and (ii) WebGraph parallel compression technique. We present a comparative study of structural characteristics of MS-BioGraphs.

The datasets are available online on https://blogs.qub.ac.uk/DIPSA/MS-BioGraphs .

BibTex

@article{MS-BioGraphs-arxiv,
    title = {{MS-BioGraphs}: Sequence Similarity Graph Datasets},
    author = {Koohi Esfahani, Mohsen and Boldi, Paolo and Vandierendonck, Hans and Kilpatrick, Peter and Vigna, Sebastiano},
    year = 2023,
    journal = {CoRR},
    volume = {abs/2308.16744},
    doi = {10.48550/arXiv.2308.16744},
    url = {https://doi.org/10.48550/arXiv.2308.16744},
    archiveprefix = {arXiv},
    eprint = {2308.16744}
}

MS-BioGraphs

Related Posts

MS-BioGraphs MS

NameMS-BioGraphs – MS
URLhttps://blogs.qub.ac.uk/DIPSA/MS-BioGraphs-MS
Download Linkhttps://doi.org/10.21227/gmd9-1534
Script for Downloading All Fileshttps://blogs.qub.ac.uk/DIPSA/MS-BioGraphs-on-IEEE-DataPort/
Validating and Sample Codehttps://blogs.qub.ac.uk/DIPSA/MS-BioGraphs-Validation/
Graph ExplanationVertices represent proteins and each edge represents the sequence similarity between its two endpoints
Edge WeightedYes
DirectedNo
Number of Vertices1,757,323,526
Number of Edges2,488,069,027,875
Maximum Degree814,957
Minimum Weight98
Maximum Weight634,925
Number of Zero-Degree Vertices6,437,984
Average Degree1,415.8
Size of The Largest WCC2,486,890,448,664
Number of WCC148,861,367
Creation DetailsMS-BioGraphs: Sequency Similarity Graph Datasets
FormatWebGraph
LicenseCC BY-NC-SA
QUB IDF2223-052
DOI10.5281/zenodo.7820808
Citation
Mohsen Koohi Esfahani, Sebastiano Vigna, 
Paolo Boldi, Hans Vandierendonck, Peter Kilpatrick, March 13, 2024, 
"MS-BioGraphs: Trillion-Scale Sequence Similarity Graph Datasets", 
IEEE Dataport, doi: https://doi.org/10.21227/gmd9-1534.
Bibtex
@data{gmd9-1534-24,
doi = {10.21227/gmd9-1534},
url = {https://doi.org/10.21227/gmd9-1534},
author = {Koohi Esfahani, Mohsen and Vigna, Sebastiano and Boldi, 
Paolo and Vandierendonck, Hans and Kilpatrick, Peter},
publisher = {IEEE Dataport},
title = {MS-BioGraphs: Trillion-Scale Sequence Similarity Graph Datasets},
year = {2024} }


Files

Underlying Graph The underlying graph in WebGraph format:
  • File: MS-underlying.graph, Size: 7,342,853,446,646 Bytes
  • File: MS-underlying.offsets, Size: 5,341,385,503 Bytes
  • File: MS-underlying.properties, Size: 1,560 Bytes
Total Size: 7,348,194,833,709 Bytes
These files are validated using ‘Edge Blocks SHAs File’ as follows.
Weights (Labels) The weights of the graph in WebGraph format:
  • File: MS-weights.labels, Size: 5,037,171,681,279 Bytes
  • File: MS-weights.labeloffsets, Size: 5,070,752,590 Bytes
  • File: MS-weights.properties, Size: 183 Bytes
Total Size: 5,042,242,434,052 Bytes
These files are validated using ‘Edge Blocks SHAs File’ as follows.
Edge Blocks SHAs File (Text) This file contains the shasums of edge blocks where each block contains 64 Million continuous edges and has one shasum for its 64M endpoints and one for its 64M edge weights.
The file is used to validate the underlying graph and the weights. For further explanation about validation process, please visit the https://blogs.qub.ac.uk/DIPSA/MS-BioGraphs-Validation.
  • Name: MS_edges_shas.txt
  • Size: 4,449,360 Bytes
  • SHASUM: 85d5b0896f8fa8a2b490ec6560937c45ced8b0d9
Offsets (Binary) The offsets array of the CSX (Compressed Sparse Rows/Columns) graph in binary format and little endian order. It consists of |V|+1 8-Bytes elements.
The first and last values are 0 and |E|, respectively.
This array helps converting the graph (or parts of it) from WebGraph format to binary format by one pass over (related) edges.
  • Name: MS_offsets.bin
  • Size: 14,058,588,216 Bytes
  • SHASUM: 15c3defdbb92f7b1fe48a3fb20530d99fa30c616
WCC (Binary) The Weakly-Connected Compontent (WCC) array in binary format and little endian order.
This array consists of |V| 4-Bytes elements The vertices in the same component have the same values in the WCC array.
  • Name: MS-wcc.bin
  • Size: 7,029,294,104 Bytes
  • SHASUM: 30f12b738dde8f62aecb94239796b169512e6710
Names (tar.gz) This compressed file contains 120 files in CSV format using ‘;’ as the separator. Each row has two columns: ID of vertex and name of the sequence.
Note: If the graph has a ‘N2O Reordering’ file, the n2o array should be used to convert the vertex ID to old vertex ID which is used for identifying name of the protein in the `names.tar.gz` file.
  • Name: names.tar.gz
  • Size: 27,130,045,933 Bytes
  • SHASUM: ba00b58bbb2795445554058a681b573c751ef315
OJSON The charactersitics of the graph and shasums of the files.
It is in the open json format and needs a closing brace (}) to be appended before being passed to a json parser.
  • Name: MS.ojson
  • Size: 700 Bytes
  • SHASUM: e2eb3fcdd0c22838971ed2edea8e1ed081a77282


Plots

For the explanation about the plots, please refer to the MS-BioGraphs paper.
To have a better resolution, please click on the images.

Degree Distribution
Weight Distribution
Vertex-Relative Weight Distribution
Degree Decomposition
Cell-Binned Average Weight Degree Distribution
Weakly-Connected Components Size Distribution


MS-BioGraphs


Related Posts

MS-BioGraphs MSA500

NameMS-BioGraphs – MSA500
URLhttps://blogs.qub.ac.uk/DIPSA/MS-BioGraphs-MSA500
Download Linkhttps://doi.org/10.21227/gmd9-1534
Script for Downloading All Fileshttps://blogs.qub.ac.uk/DIPSA/MS-BioGraphs-on-IEEE-DataPort/
Validating and Sample Codehttps://blogs.qub.ac.uk/DIPSA/MS-BioGraphs-Validation/
Graph ExplanationVertices represent proteins and each edge represents the sequence similarity between its two endpoints
Edge WeightedYes
DirectedYes
Number of Vertices1,757,323,526
Number of Edges1,244,904,754,157
Maximum In-Degree229,442
Maximum Out-Degree814,461
Minimum Weight98
Maximum Weight634,925
Number of Zero In-Degree Vertices6,437,984
Number of Zero Out-Degree Vertices16,843,087
Average In-Degree711.0
Average Out-Degree715.3
Size of The Largest Weakly Connected Component1,244,203,865,823
Number of Weakly Connected Components148,861,367
Creation DetailsMS-BioGraphs: Sequency Similarity Graph Datasets
FormatWebGraph
LicenseCC BY-NC-SA
QUB IDF2223-052
DOI10.5281/zenodo.7820810
Citation
Mohsen Koohi Esfahani, Sebastiano Vigna, 
Paolo Boldi, Hans Vandierendonck, Peter Kilpatrick, March 13, 2024, 
"MS-BioGraphs: Trillion-Scale Sequence Similarity Graph Datasets", 
IEEE Dataport, doi: https://doi.org/10.21227/gmd9-1534.
Bibtex
@data{gmd9-1534-24,
doi = {10.21227/gmd9-1534},
url = {https://doi.org/10.21227/gmd9-1534},
author = {Koohi Esfahani, Mohsen and Vigna, Sebastiano and Boldi, 
Paolo and Vandierendonck, Hans and Kilpatrick, Peter},
publisher = {IEEE Dataport},
title = {MS-BioGraphs: Trillion-Scale Sequence Similarity Graph Datasets},
year = {2024} }


Files

Underlying Graph The underlying graph in WebGraph format:
  • File: MSA500-underlying.graph, Size: 3,755,604,574,487 Bytes
  • File: MSA500-underlying.offsets, Size: 4,811,273,232 Bytes
  • File: MSA500-underlying.properties, Size: 1,537 Bytes
Total Size: 3,760,415,849,256 Bytes
These files are validated using ‘Edge Blocks SHAs File’ as follows.
Weights (Labels) The weights of the graph in WebGraph format:
  • File: MSA500-weights.labels, Size: 2,520,671,185,509 Bytes
  • File: MSA500-weights.labeloffsets, Size: 4,554,987,345 Bytes
  • File: MSA500-weights.properties, Size: 187 Bytes
Total Size: 2,525,226,173,041 Bytes
These files are validated using ‘Edge Blocks SHAs File’ as follows.
Edge Blocks SHAs File (Text) This file contains the shasums of edge blocks where each block contains 64 Million continuous edges and has one shasum for its 64M endpoints and one for its 64M edge weights.
The file is used to validate the underlying graph and the weights. For further explanation about validation process, please visit the https://blogs.qub.ac.uk/DIPSA/MS-BioGraphs-Validation.
  • Name: MSA500_edges_shas.txt
  • Size: 2,226,360 Bytes
  • SHASUM: d9f692b6f4770f282ea62936293baf6a649c2b91
Offsets (Binary) The offsets array of the CSX (Compressed Sparse Rows/Columns) graph in binary format and little endian order. It consists of |V|+1 8-Bytes elements.
The first and last values are 0 and |E|, respectively.
This array helps converting the graph (or parts of it) from WebGraph format to binary format by one pass over (related) edges.
  • Name: MSA500_offsets.bin
  • Size: 14,058,588,216 Bytes
  • SHASUM: 3eab31d99426ed9f96af6b258fd1253544ba5461
WCC (Binary) The Weakly-Connected Compontent (WCC) array in binary format and little endian order.
This array consists of |V| 4-Bytes elements The vertices in the same component have the same values in the WCC array.
  • Name: MSA500-wcc.bin
  • Size: 7,029,294,104 Bytes
  • SHASUM: 30f12b738dde8f62aecb94239796b169512e6710
Transposed’s Offsets (Binary) The offsets array of the transposed graph in binary format and little endian order. It consists of |V|+1 8-Bytes elements. The first and last values are 0 and |E|, respectively.
It helps to transpose the graph by performing one pass over edges.
  • Name: MSA500_trans_offsets.bin
  • Size: 14,058,588,216 Bytes
  • SHASUM: 220a2a5c60baaedc8913720862b535ba6cabb5bd
Names (tar.gz) This compressed file contains 120 files in CSV format using ‘;’ as the separator. Each row has two columns: ID of vertex and name of the sequence.
Note: If the graph has a ‘N2O Reordering’ file, the n2o array should be used to convert the vertex ID to old vertex ID which is used for identifying name of the protein in the `names.tar.gz` file.
  • Name: names.tar.gz
  • Size: 27,130,045,933 Bytes
  • SHASUM: ba00b58bbb2795445554058a681b573c751ef315
OJSON The charactersitics of the graph and shasums of the files.
It is in the open json format and needs a closing brace (}) to be appended before being passed to a json parser.
  • Name: MSA500.ojson
  • Size: 902 Bytes
  • SHASUM: 5eaebdff2dc56925a0b4751f579ebeabb6e3bee5


Plots

For the explanation about the plots, please refer to the MS-BioGraphs paper.
To have a better resolution, please click on the images.

In-Degree Distribution
Out-Degree Distribution
Weight Distribution
Vertex-Relative Weight Distribution
Degree Decomposition
Push and Pull Locality
Cell-Binned Average Weight Degree Distribution
Weakly-Connected Components Size Distribution


MS-BioGraphs


Related Posts