| Name | MS-BioGraphs – MS |
| URL | https://blogs.qub.ac.uk/DIPSA/MS-BioGraphs-MS |
| Download Link | https://doi.org/10.21227/gmd9-1534 |
| Script for Downloading All Files | https://blogs.qub.ac.uk/DIPSA/MS-BioGraphs-on-IEEE-DataPort/ |
| Validating and Sample Code | https://blogs.qub.ac.uk/DIPSA/MS-BioGraphs-Validation/ |
| Graph Explanation | Vertices represent proteins and each edge represents the sequence similarity between its two endpoints |
| Edge Weighted | Yes |
| Directed | No |
| Number of Vertices | 1,757,323,526 |
| Number of Edges | 2,488,069,027,875 |
| Maximum Degree | 814,957 |
| Minimum Weight | 98 |
| Maximum Weight | 634,925 |
| Number of Zero-Degree Vertices | 6,437,984 |
| Average Degree | 1,415.8 |
| Size of The Largest WCC | 2,486,890,448,664 |
| Number of WCC | 148,861,367 |
| Creation Details | MS-BioGraphs: Sequency Similarity Graph Datasets |
| Format | WebGraph |
| License | CC BY-NC-SA |
| QUB IDF | 2223-052 |
| DOI | 10.5281/zenodo.7820808 |
| Citation | Mohsen Koohi Esfahani, Sebastiano Vigna, Paolo Boldi, Hans Vandierendonck, Peter Kilpatrick, March 13, 2024, "MS-BioGraphs: Trillion-Scale Sequence Similarity Graph Datasets", IEEE Dataport, doi: https://doi.org/10.21227/gmd9-1534. |
| Bibtex | @data{gmd9-1534-24,
doi = {10.21227/gmd9-1534},
url = {https://doi.org/10.21227/gmd9-1534},
author = {Koohi Esfahani, Mohsen and Vigna, Sebastiano and Boldi,
Paolo and Vandierendonck, Hans and Kilpatrick, Peter},
publisher = {IEEE Dataport},
title = {MS-BioGraphs: Trillion-Scale Sequence Similarity Graph Datasets},
year = {2024} } |
Files
| Underlying Graph |
The underlying graph in WebGraph format:
These files are validated using ‘Edge Blocks SHAs File’ as follows. |
| Weights (Labels) |
The weights of the graph in WebGraph format:
These files are validated using ‘Edge Blocks SHAs File’ as follows. |
| Edge Blocks SHAs File (Text) |
This file contains the shasums of edge blocks where each block contains
64 Million continuous edges and has one shasum for its 64M endpoints and
one for its 64M edge weights. The file is used to validate the underlying graph and the weights. For further explanation about validation process, please visit the https://blogs.qub.ac.uk/DIPSA/MS-BioGraphs-Validation.
|
| Offsets (Binary) |
The offsets array of the CSX (Compressed Sparse Rows/Columns) graph in binary
format and little endian order. It consists of |V|+1 8-Bytes elements. The first and last values are 0 and |E|, respectively. This array helps converting the graph (or parts of it) from WebGraph format to binary format by one pass over (related) edges.
|
| WCC (Binary) |
The Weakly-Connected Compontent (WCC) array in binary format and little endian order. This array consists of |V| 4-Bytes elements The vertices in the same component have the same values in the WCC array.
|
| Names (tar.gz) |
This compressed file contains 120 files in CSV format using ‘;’ as the separator.
Each row has two columns: ID of vertex and name of the sequence. Note: If the graph has a ‘N2O Reordering’ file, the n2o array should be used to convert the vertex ID to old vertex ID which is used for identifying name of the protein in the `names.tar.gz` file.
|
| OJSON |
The charactersitics of the graph and shasums of the files. It is in the open json format and needs a closing brace (}) to be appended before being passed to a json parser.
|
Plots
For the explanation about the plots, please refer to the MS-BioGraphs paper.
To have a better resolution, please click on the images.
| Degree Distribution | 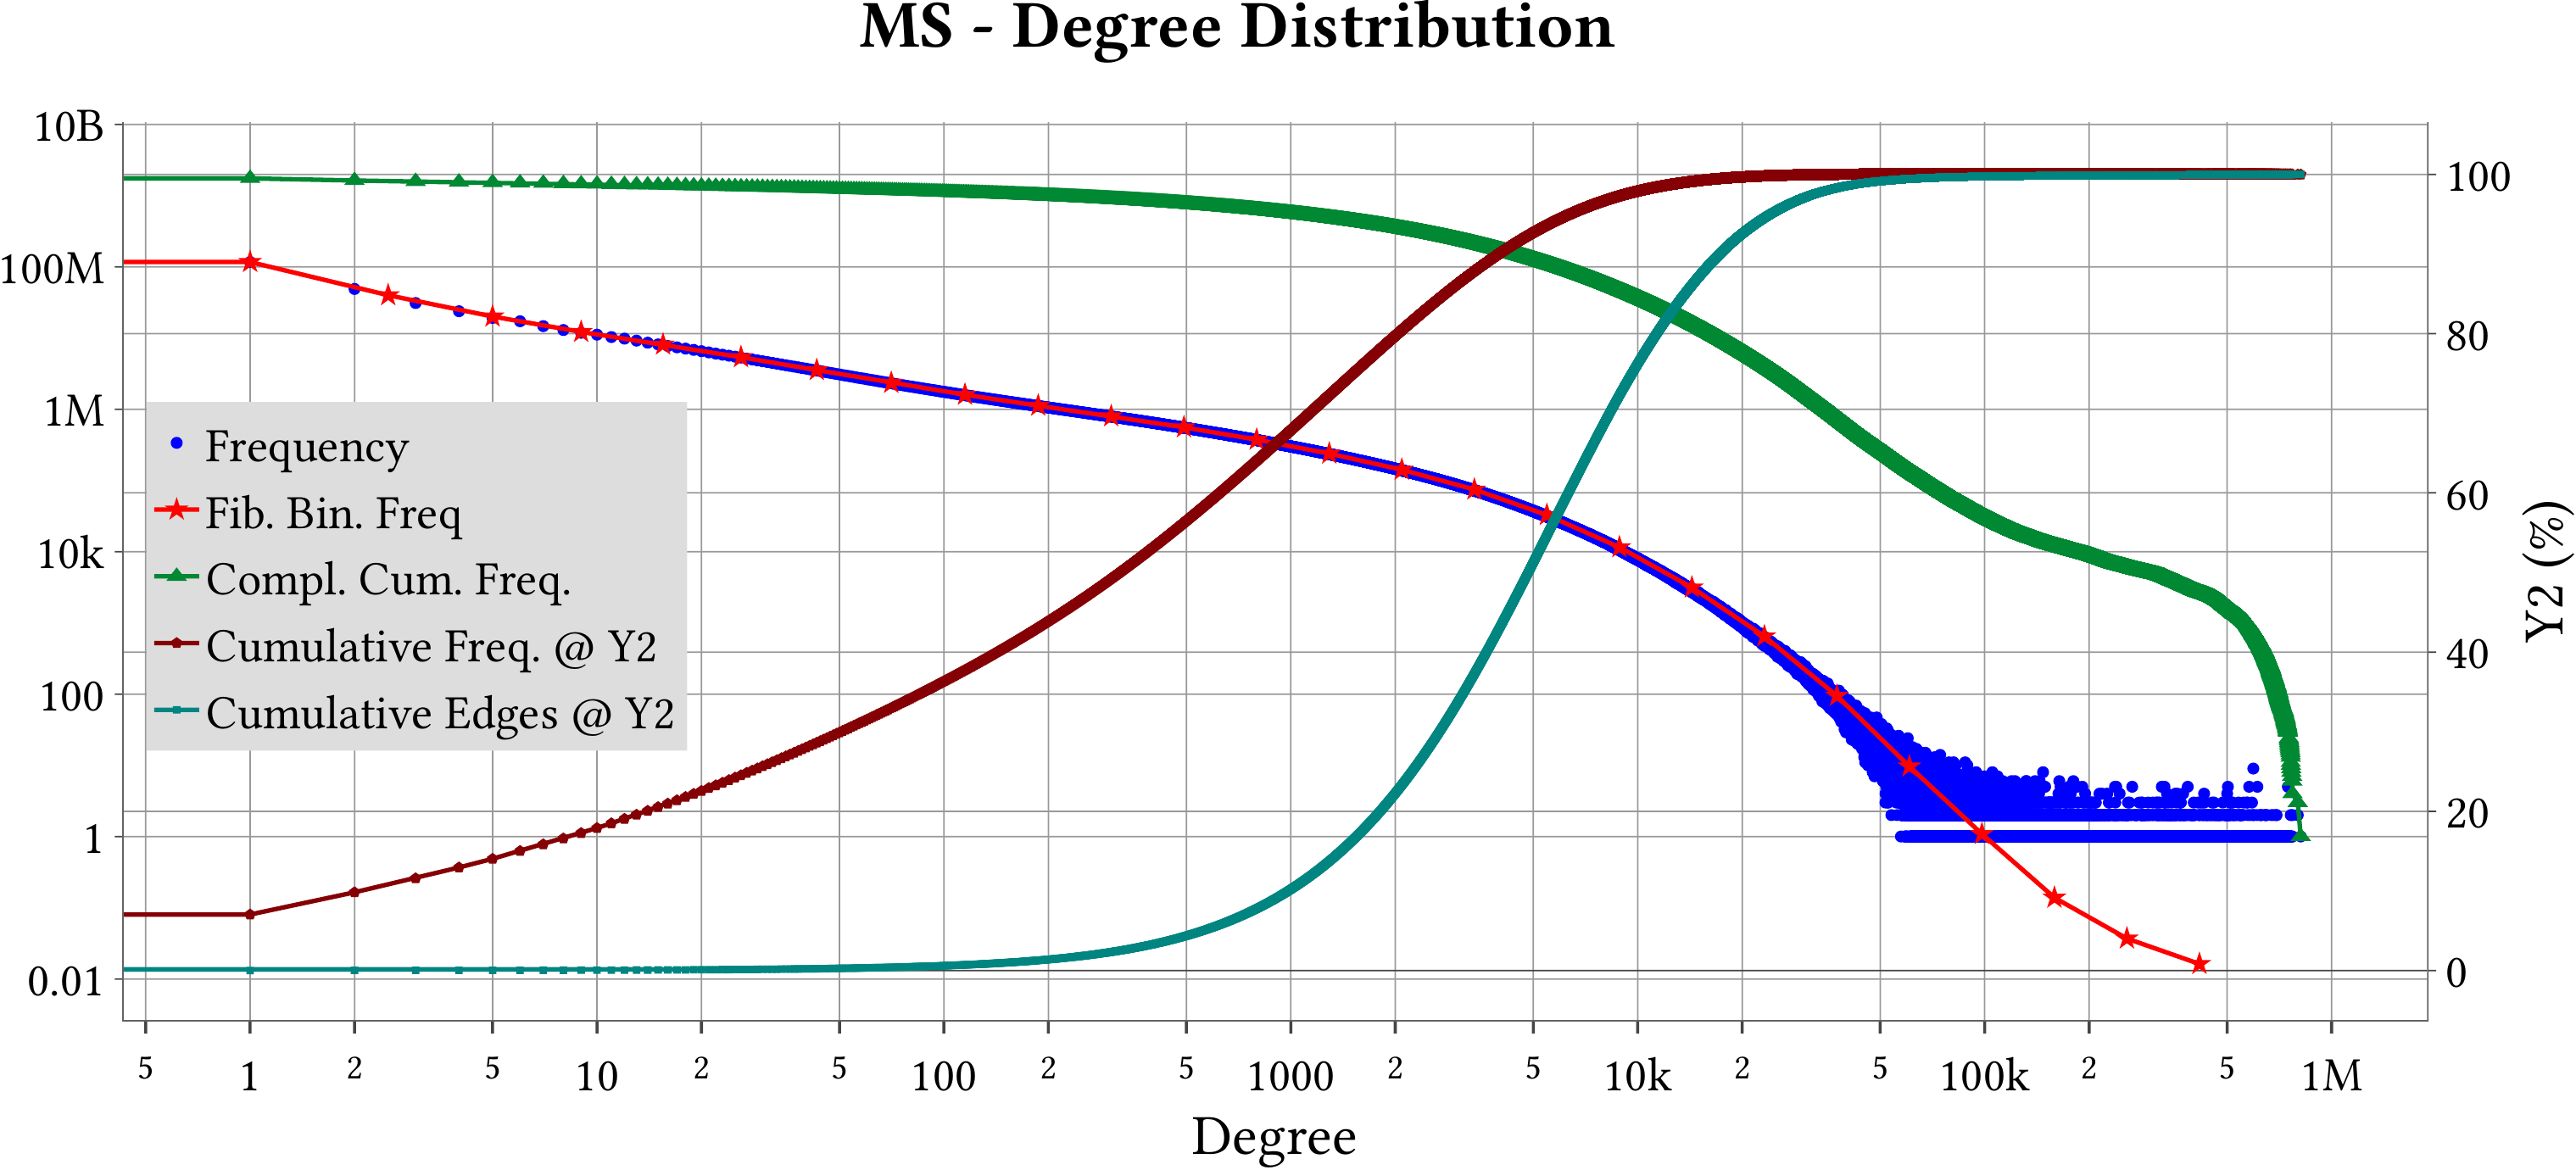 |
| Weight Distribution | 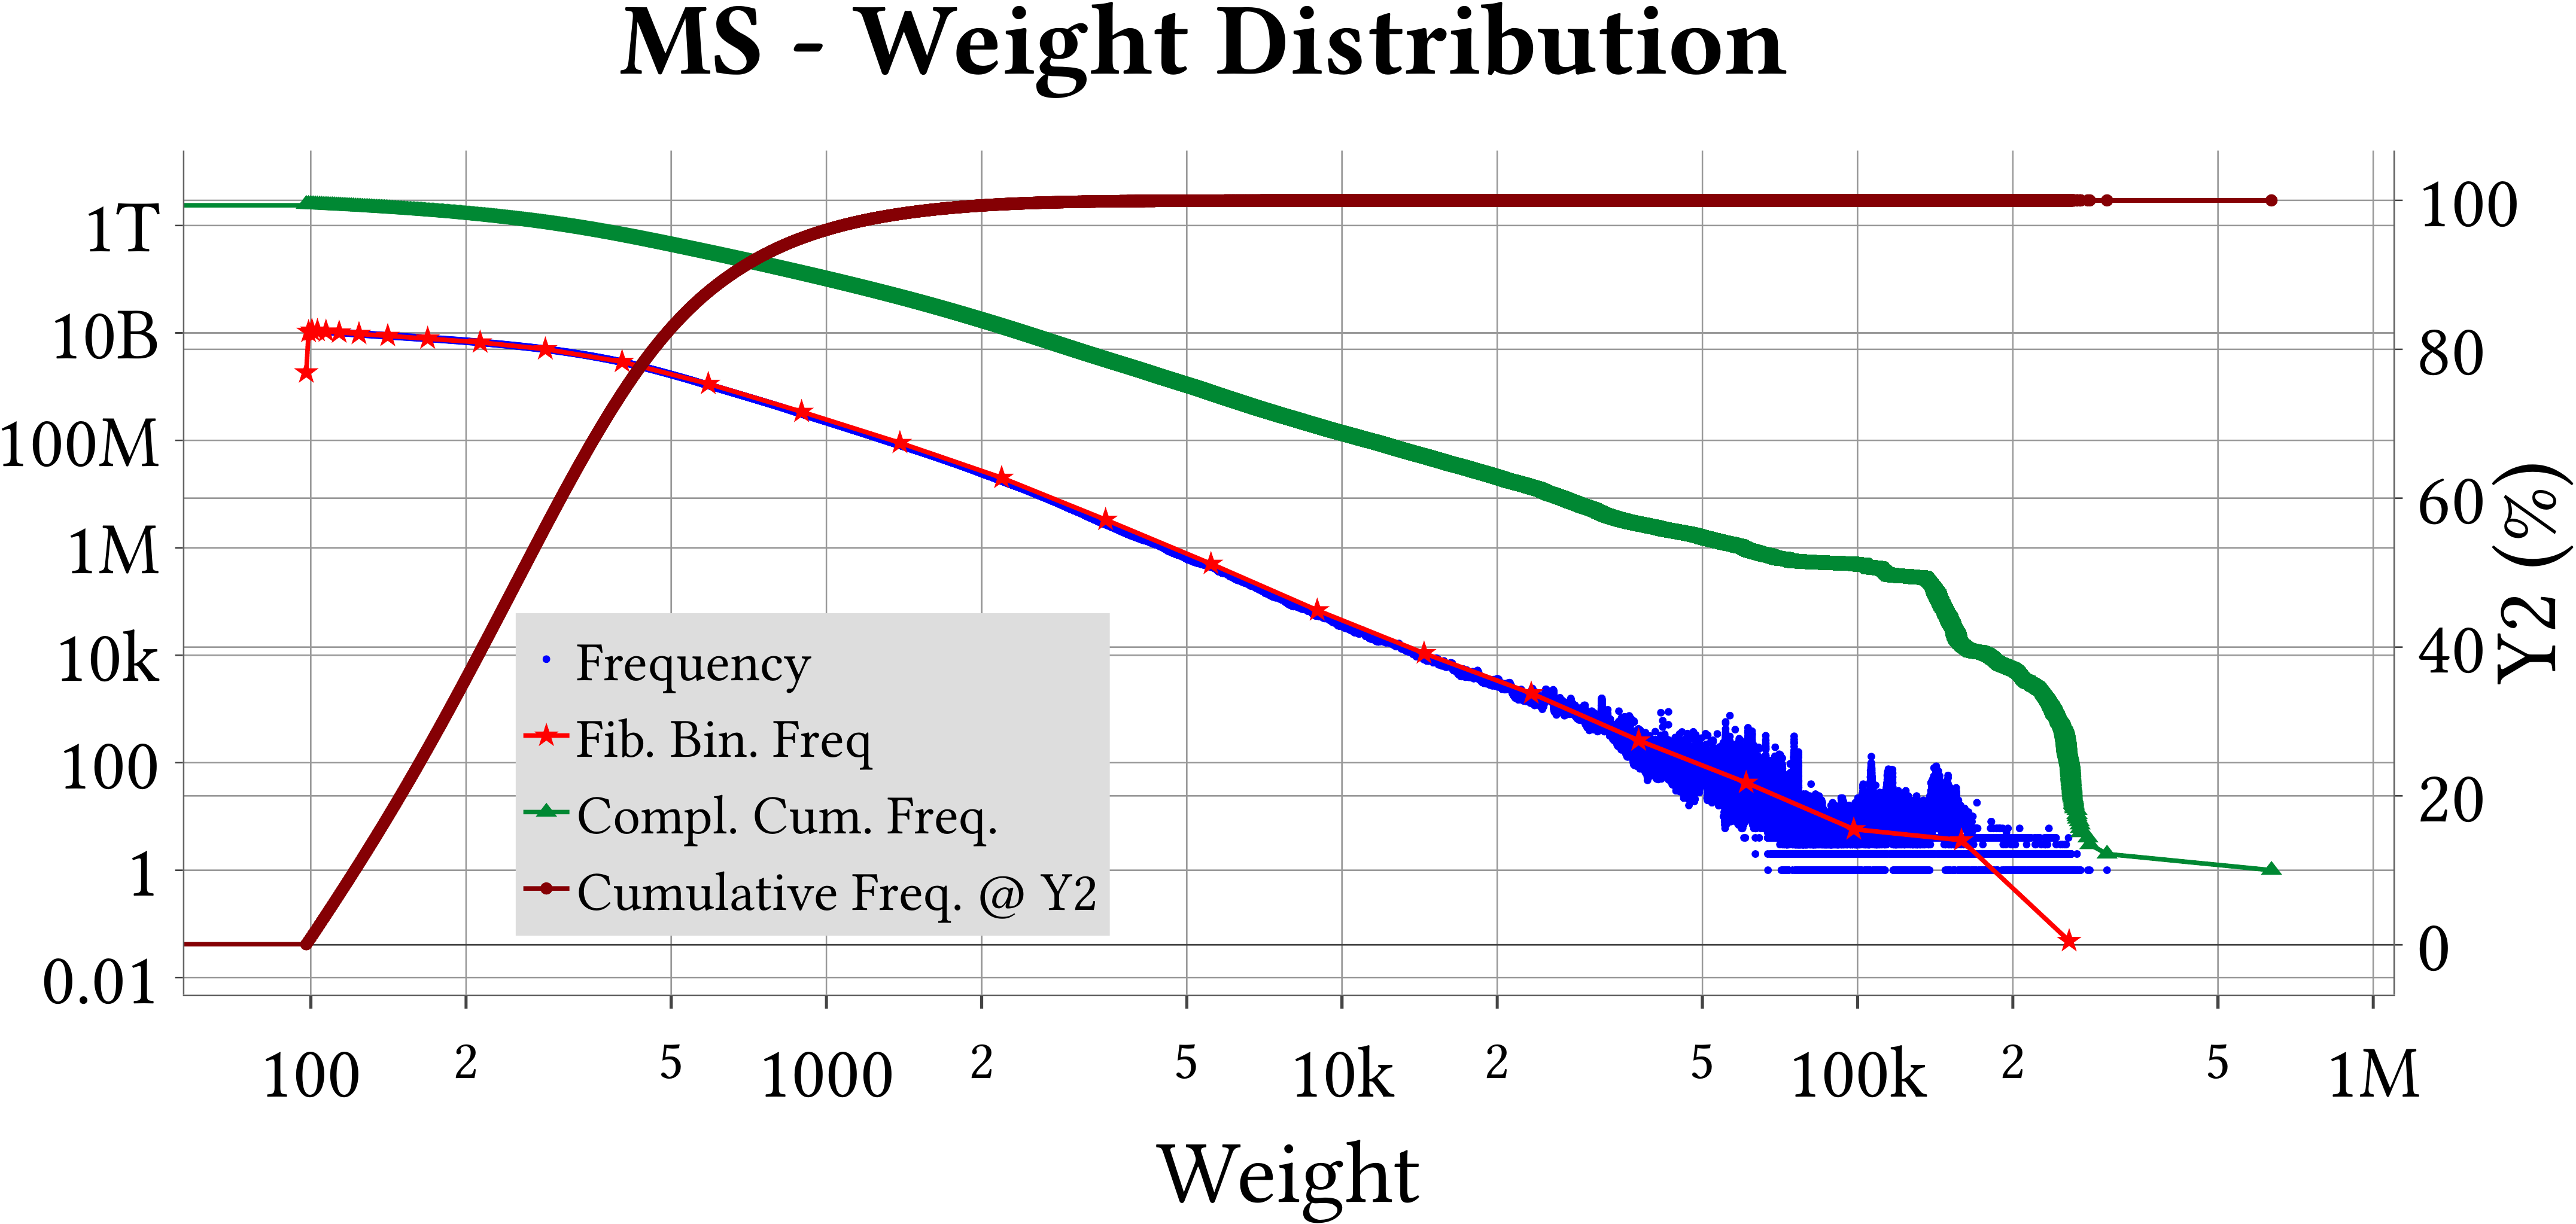 |
| Vertex-Relative Weight Distribution | 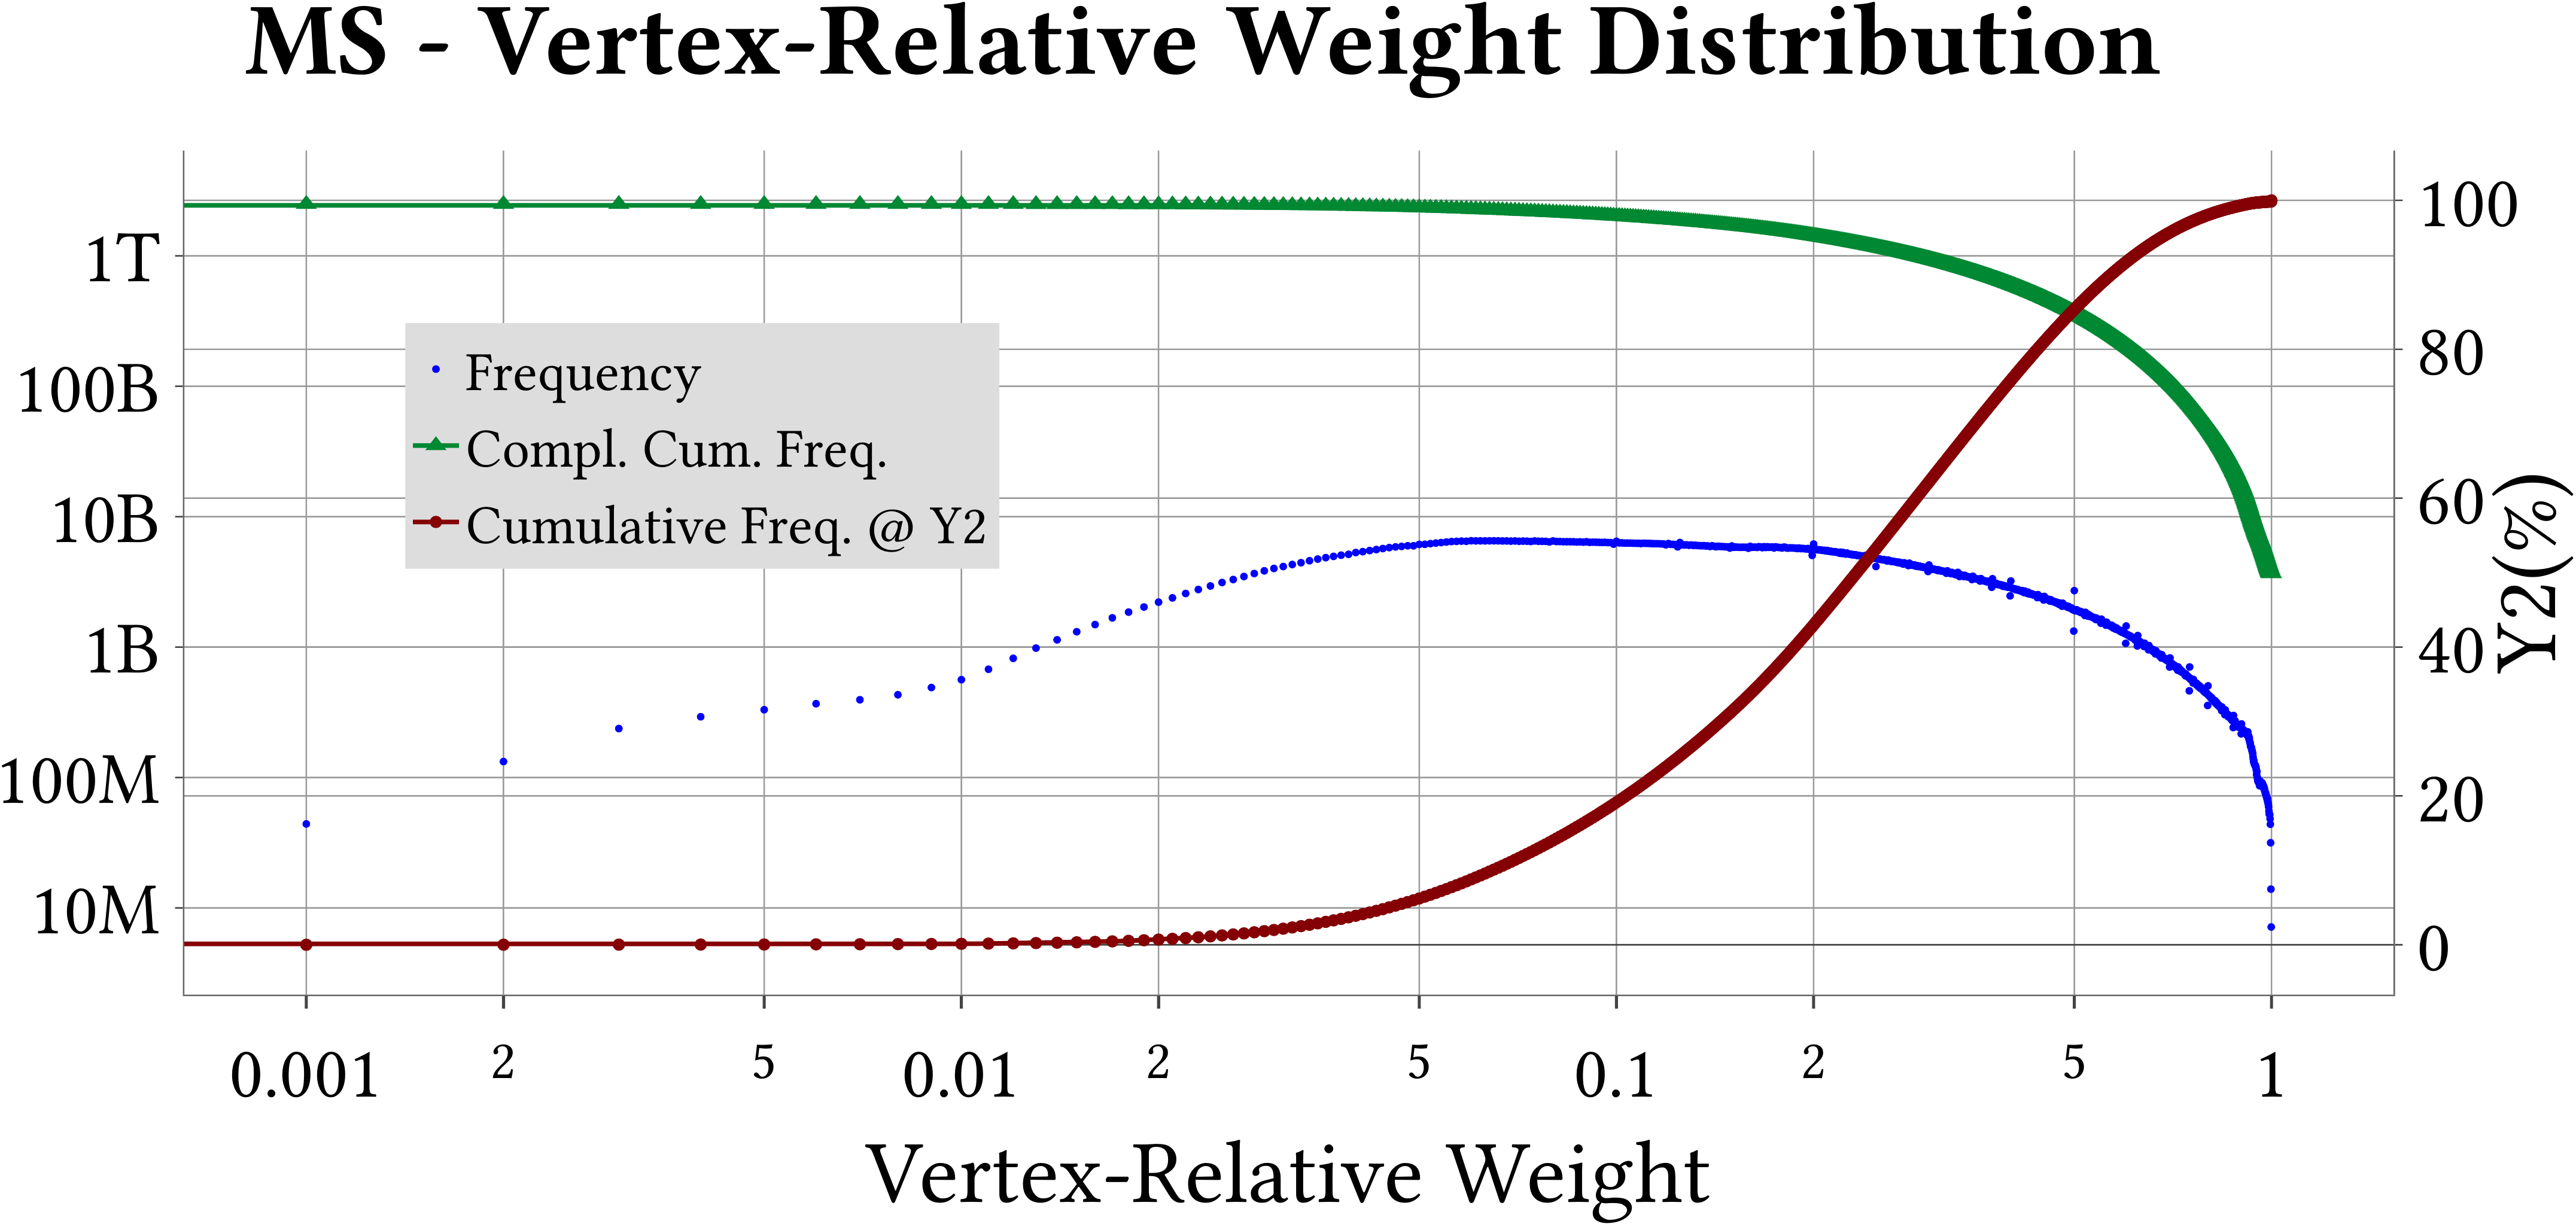 |
| Degree Decomposition | 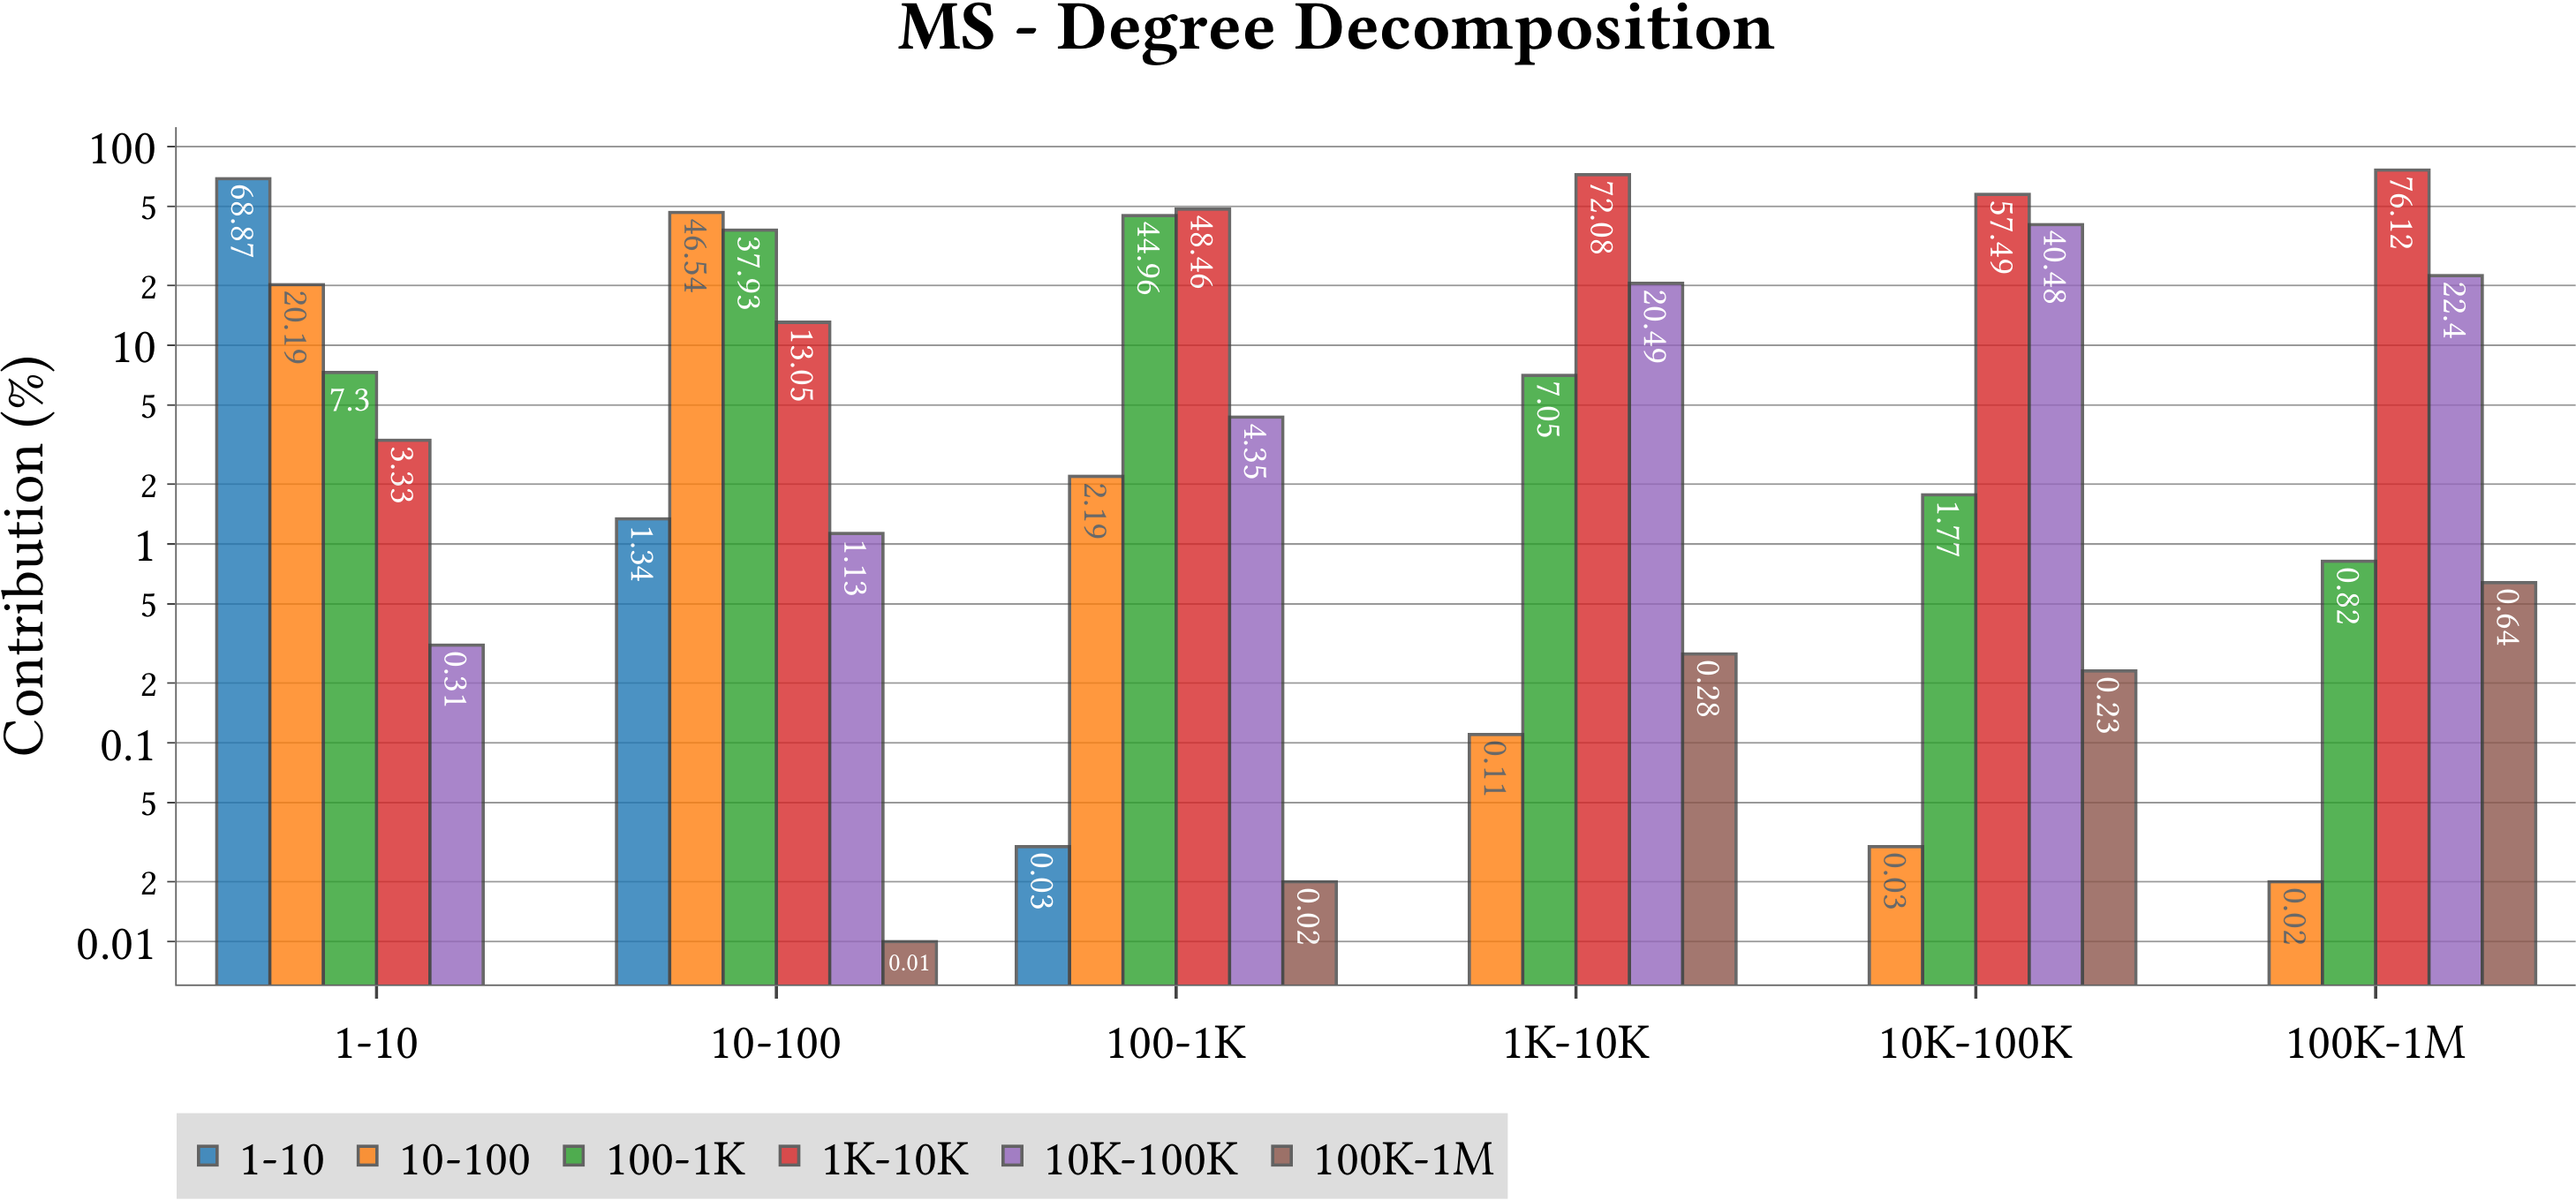 |
| Cell-Binned Average Weight Degree Distribution | 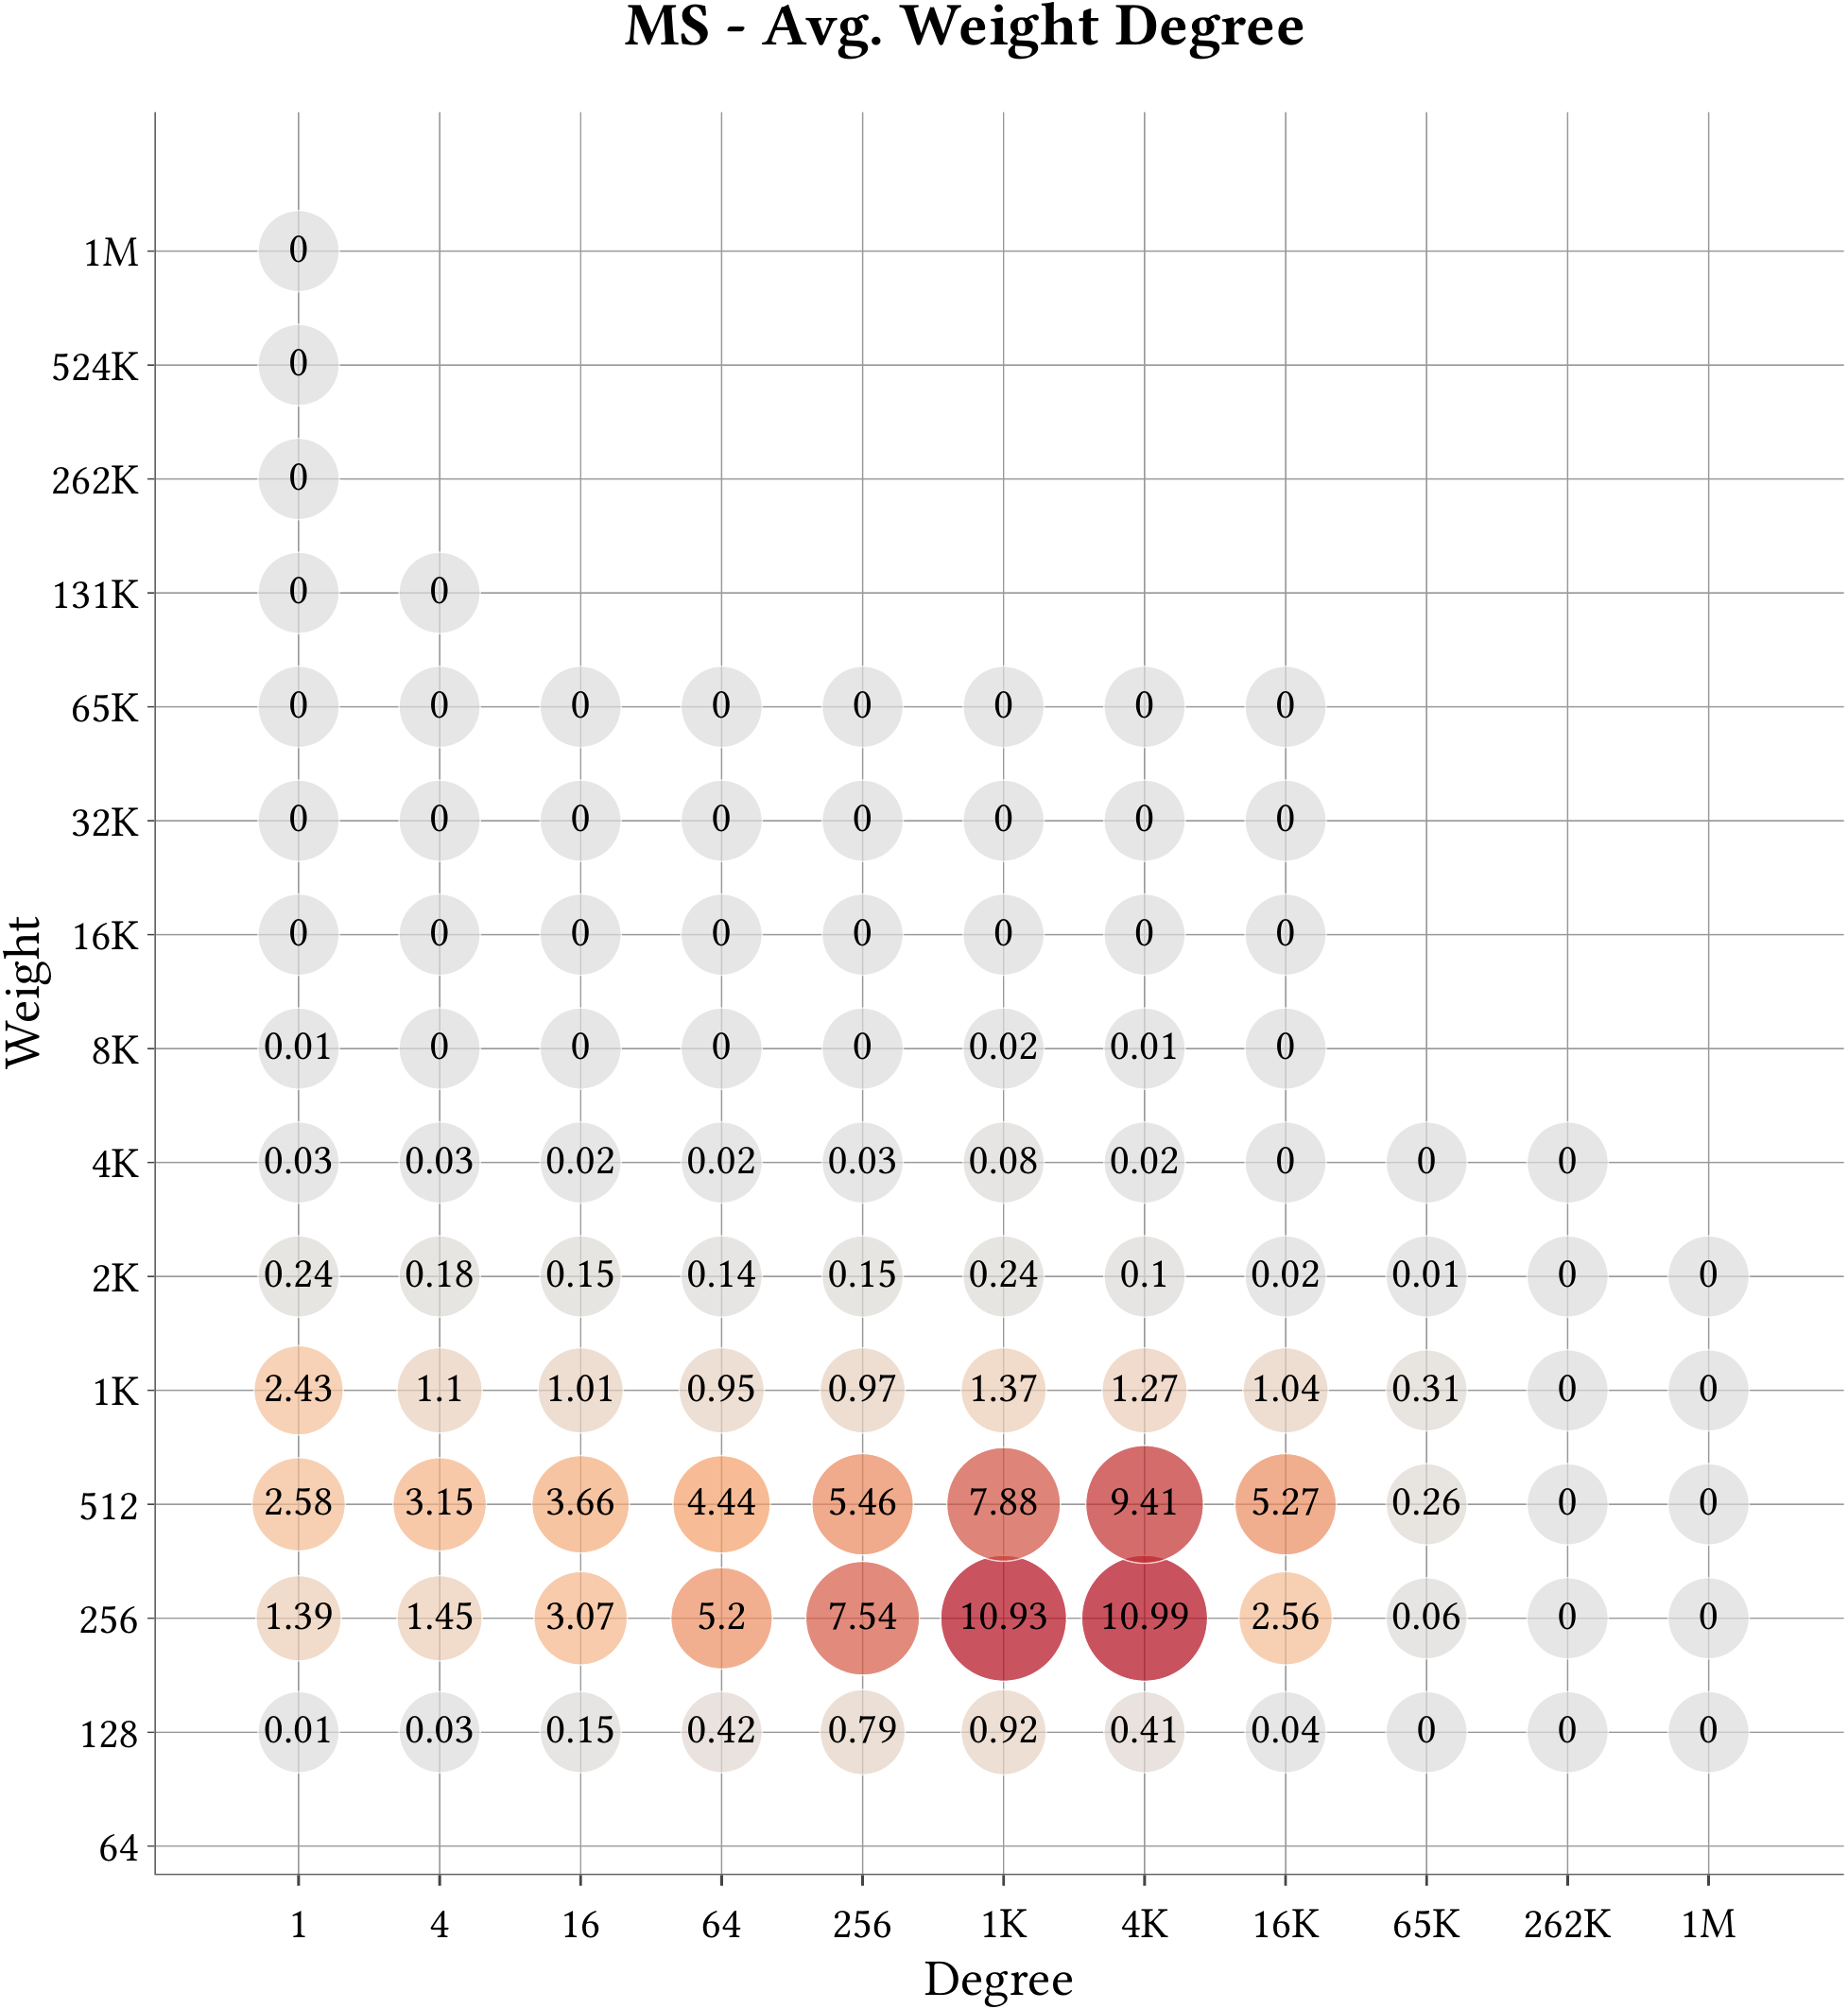 |
| Weakly-Connected Components Size Distribution | 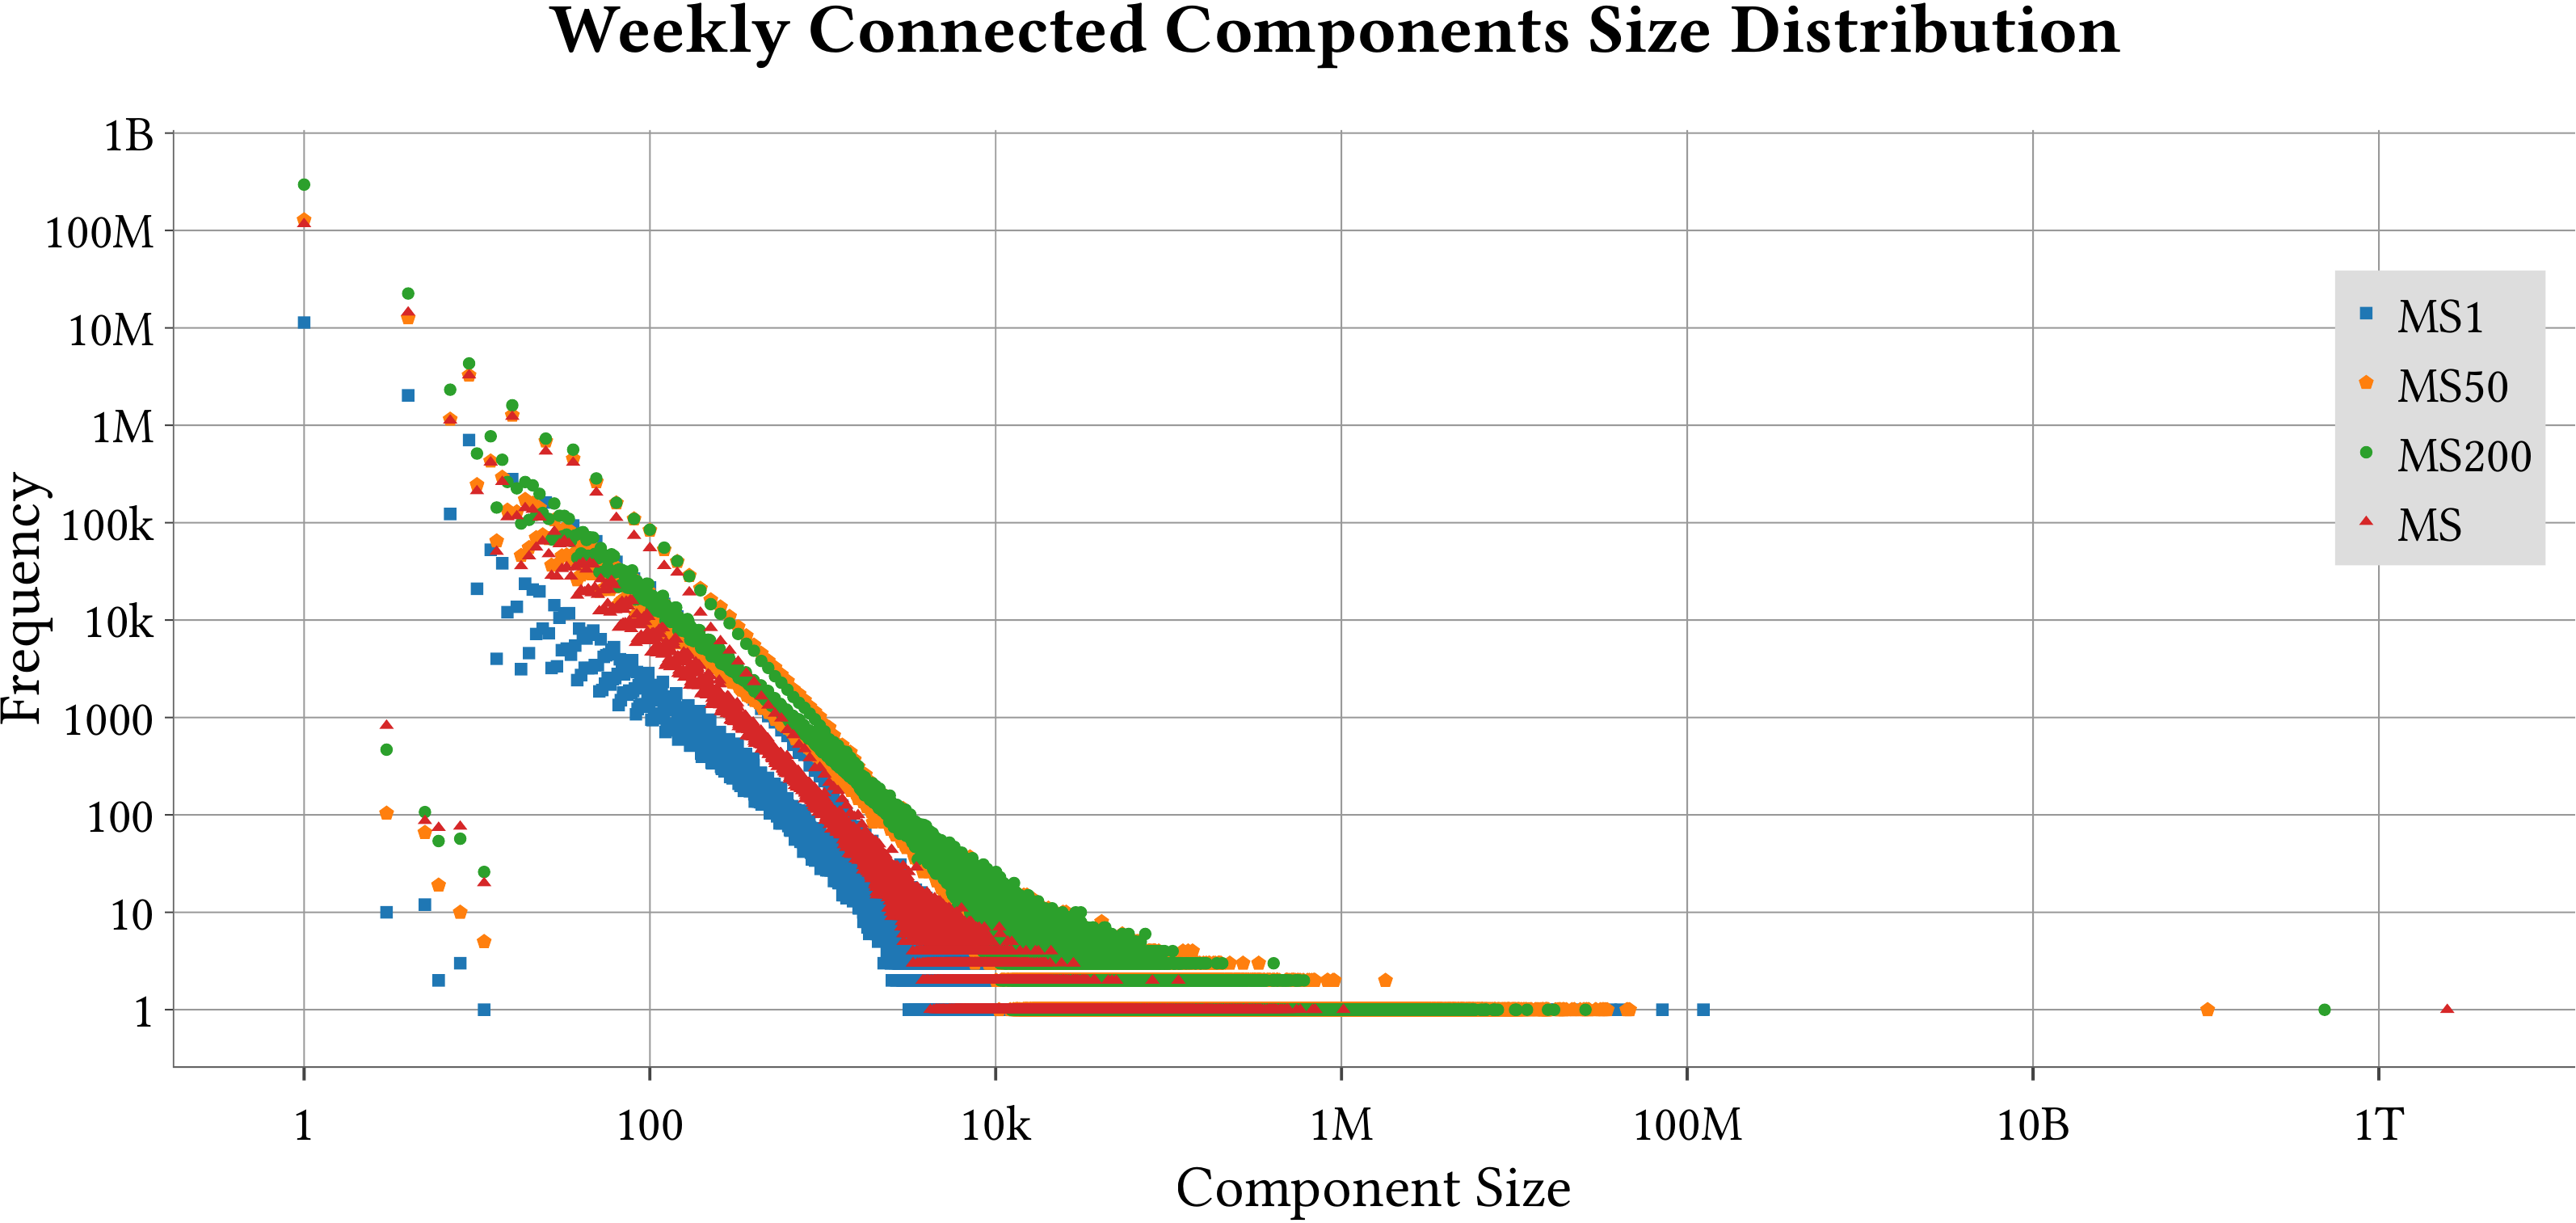 |
Related Posts
- Minimum Spanning Forest of MS-BioGraphs

- MS-BioGraphs on IEEE DataPort
- ParaGrapher Source Code For WebGraph Types
- On Overcoming HPC Challenges of Trillion-Scale Real-World Graph Datasets – BigData’23 (Short Paper)
- Dataset Announcement: MS-BioGraphs, Trillion-Scale Public Real-World Sequence Similarity Graphs – IISWC’23 (Poster)
- MS-BioGraphs: Sequence Similarity Graph Datasets
- MS-BioGraphs MS
- MS-BioGraphs MSA500
- MS-BioGraphs MS200
- MS-BioGraphs MSA200
- MS-BioGraphs MS50
- MS-BioGraphs MSA50
- MS-BioGraphs MSA10
- MS-BioGraphs MS1
- MS-BioGraphs Validation