
1. What predicts the waiting time?
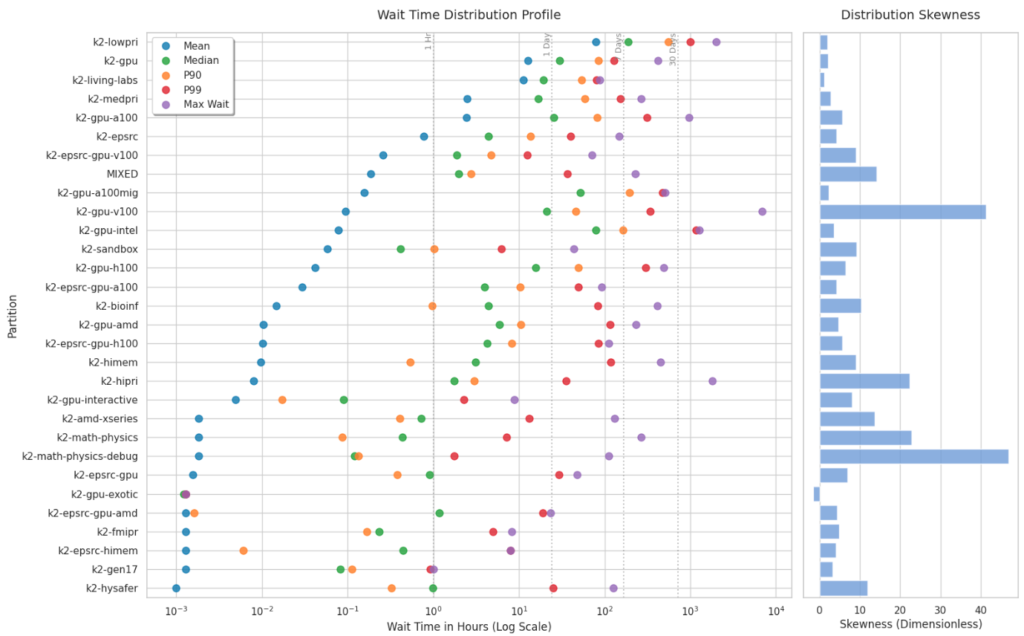
The factors that best predict how long a job will wait in the queue vary significantly depending on the specific cluster partition.
- Requested Hardware: For general and high-priority partitions like
k2-hipri,k2-lowpri, andk2-sandbox, the amount of requested memory is the strongest predictor of wait time, accounting for 54.1%, 43.6%, and 48.6% of the variance, respectively. For GPU-specific partitions, the number of requested GPUs is naturally the dominant factor, predicting 45.6% of the wait time onk2-gpu-h100and 31.4% onk2-gpu. - Administrative Priority: The priority number assigned to the job overwhelmingly dictates the wait time, carrying a 96.2% and 92.4% feature importance weight.
- Cluster Congestion: Wait times correlate strongly with recent cluster load. The correlation matrix shows that the volume of jobs submitted in the last 1 hour (0.43), 3 hours (0.40), and 6 hours (0.39) positively correlates with wait times.
- Submission Timing: In certain partitions, like
k2-gpu-intel, the hour of the day the job is submitted is the most significant factor, accounting for 78.1% of the wait time variance.
2. What is the utilisation of the various nodes?
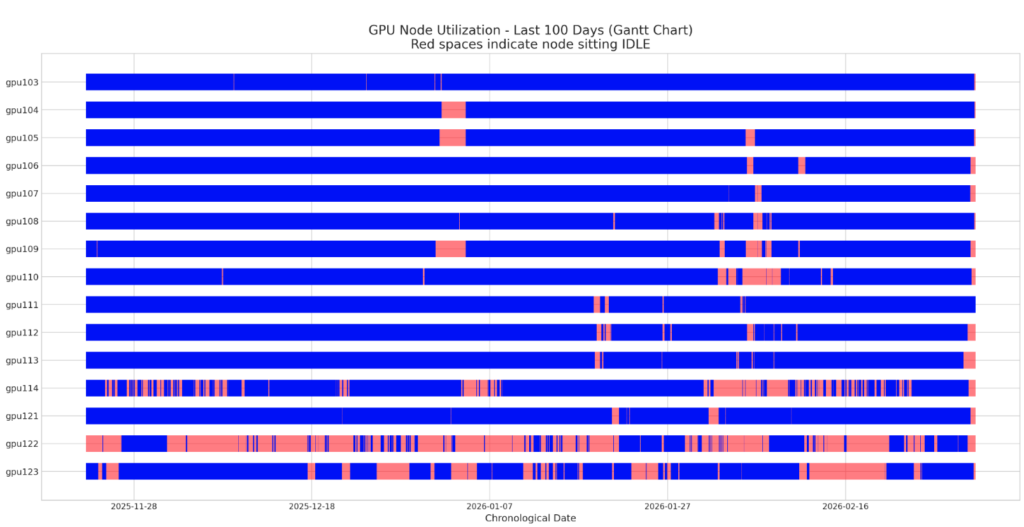
Node utilisation across the cluster is highly uneven, with some resources heavily saturated and others frequently sitting idle.
- High Utilisation (V100 and A100 Nodes): Many of the standard GPU nodes run almost continuously. Over a 110-day period,
gpu103was idle for only 0.44% of the time,gpu107for 1.34%, andgpu111for 1.70%. - Low Utilisation (Specialized Nodes): Conversely, specialized hardware exhibits significant downtime. The Intel GPU node (
gpu122) sat idle 66.73% of the time, and the AMD GPU node (gpu123) was idle 28.36% of the time. The partitioned A100MIG node (gpu114) also showed a high idle rate of 27.03%. The Gantt chart visually confirms this, showing large continuous red bands indicating idle periods for these specific nodes. - Allocation vs. Actual Compute: While the CPU allocation ratio is perfectly saturated (1.0) on standard partitions, like
k2-gpuandk2-lowpri, the actual “CPU Core Efficiency” ranges from just 33.42% to 52.23%. This indicates that the system considers the CPUs “in use” and unavailable to others, even though they are frequently not actively computing.
3. How appropriately are the resources requested?
The data heavily implies that users consistently and significantly over-request resources compared to what their jobs actually require.
- Severe Memory Inefficiency: Memory requests are profoundly disproportionate to actual usage. Across virtually all detailed GPU nodes and partitions (like
k2-gpu-intel,k2-gpu, andk2-epsrc-gpu), memory efficiency hovers between a practically non-existent 0.01% and 0.03%. Even on general CPU partitions likek2-living-labs, memory efficiency only reaches 16.12%. - Time Limit Overestimation: Users routinely overestimate the wall-clock time required for their jobs. Time efficiency generally sits between 13.71% and 18.87% for most GPU nodes, meaning jobs finish much faster than the bounds they reserve. The
k2-epsrc-gpupartition is particularly egregious, showing an incredibly low time efficiency of just 2.32%. - Compute Core Inefficiency: CPU Core efficiency reaches a maximum of 56.82% (on node
gpu110) and drops as low as 4.02% fork2-gpu-interactive.
4. Is the reported energy consumption proportional to the reported utilisation and requested resources?
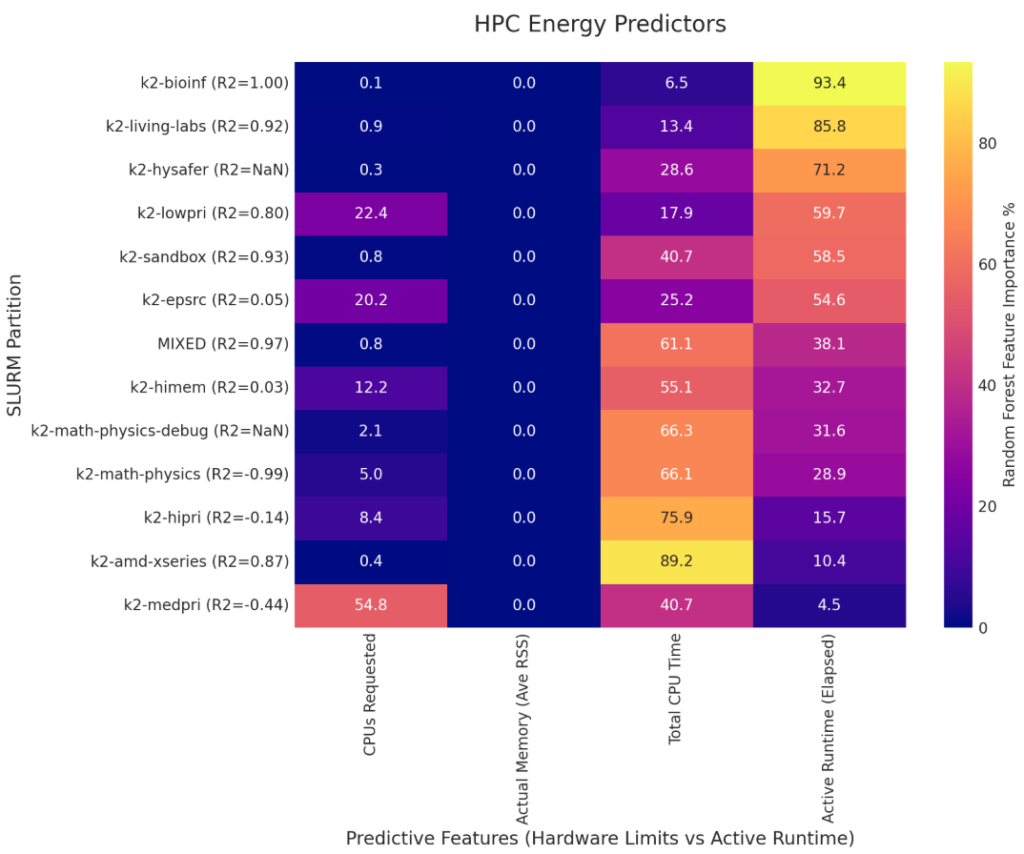
Energy consumption is largely proportional to active compute time rather than the volume of requested resources, though wasted energy from failed jobs is a major outlier.
- The irrelevance of requested memory: Despite users requesting vast amounts of memory, “Memory Requested” has a 0.0% feature importance for predicting energy consumption across all listed partitions.
- Runtime as the Primary Driver: For successfully completed jobs, “Active Runtime (Elapsed)” and “Total CPU Time” are the dominant drivers of energy use. For example, Active Runtime accounts for 93.4% of the energy variance in
k2-bioinf, while Total CPU Time accounts for 89.2% ink2-amd-xseries. - The Wasted Energy Problem: While 98.3% of the cluster’s energy is spent on safely completed jobs, the remaining 1.7% is spent on jobs that ultimately fail. The
k2-medpripartition is uniquely problematic, accounting for approximately 99% of all wasted cluster energy. This is driven by over 60,000 failed jobs (including thousands of “Out of Memory” errors and timeouts), where jobs consume power for up to an entire day before crashing. Furthermore, the energy model fork2-medprishows that “CPUs Requested” awkwardly drives 54.8% of the energy variance for completed jobs in that partition, showcasing how misconfigured requests on that specific partition actively burn excess power.


