Lorraine Barry, Geographical Information Scientist from the GIS Research and Teaching Unit at GAP comments on 3D local visualisation based on open source methods and open spatial data.
Traditionally within a geographical information software system (GIS) modelling spatial features in 3D has been cumbersome and difficult. Much progress has been made in the last few years in the IT field in the development of libraries to create and visualise animated 3D graphics in a web browser. An example of such is Three.js, a cross browser JavaScript library hosted openly since 2010. Advances in such programming and web capability coupled with an increasing emergence of access to rich and detailed open spatial data has paved the way for improved 3D spatial visualisation.
To show example of the use of open source local data with the power of open source visualisation, a 3D model of the tree landscape in Botanic Gardens, Belfast has been created.
OpenDataNI, part of the Digital NI initiative, provides an open data portal with a wide variety of spatial data. One dataset of immediate interest on the portal is the tree database provided by Belfast City Council. Mapping and analysis of trees is of recent value and interest for planning, landuse, carbon potential, environmental quality assessment….. Tree surveys and their spatial assessment are now part of city and council management. Belfast’s trees can be mapped and analysed spatially for quality, type and density. When combined with open elevation data; open background vector mapping; and the capability of 3D plug-in libraries, the potential for large scale open 3D visualisations are superb.
Output figures 1 & 2 illustrate the trees within Botanic Gardens visualised in their real-world locations but with a uniform height. Output figure 3 illustrates actual tree heights as recorded by Belfast City Council within the tree database.
Figure 1
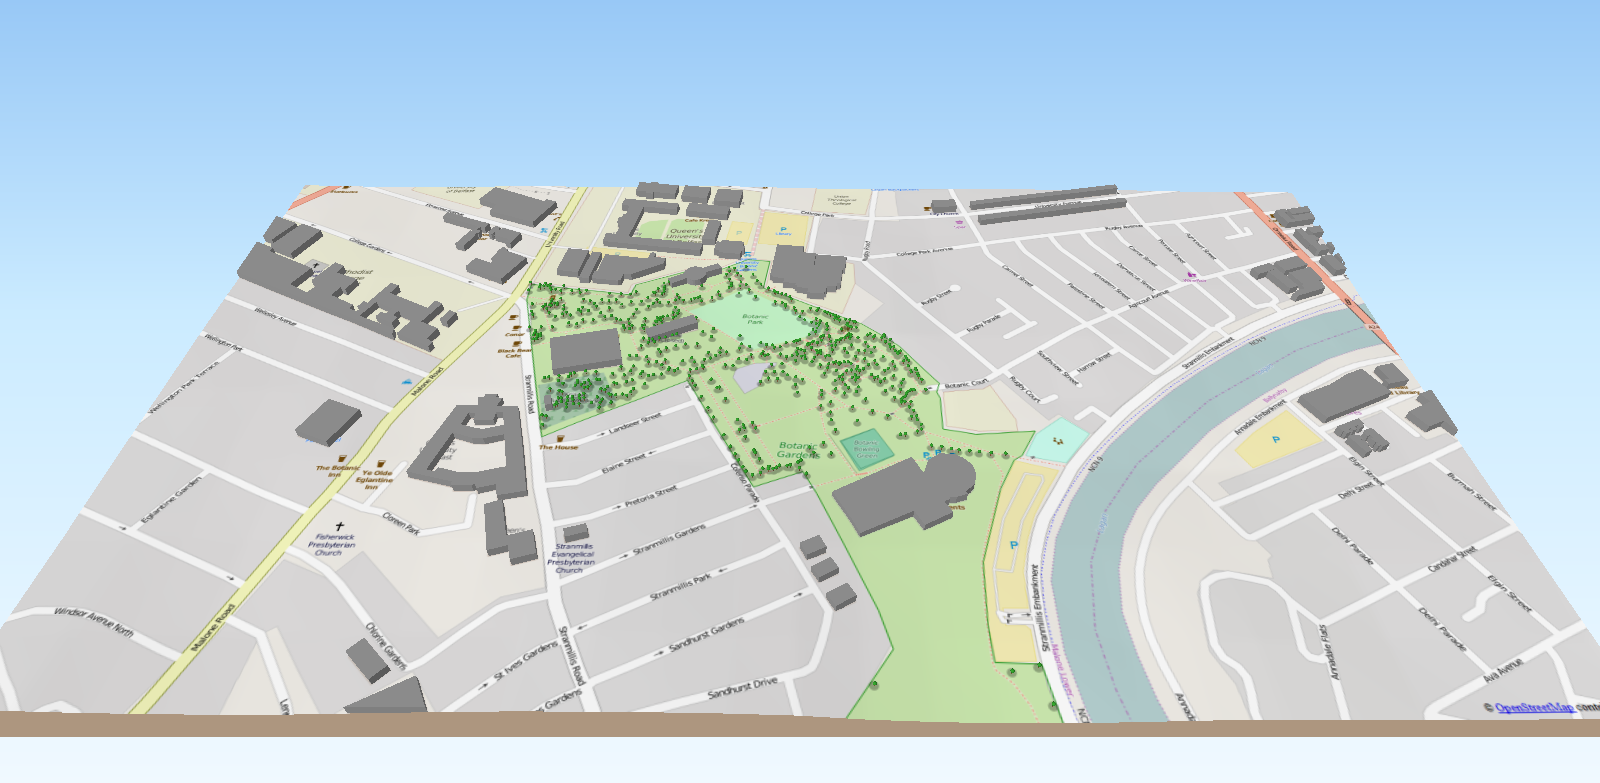
Image created from open spatial data and methods by Lorraine Barry, GIS, QUB
Figure 2
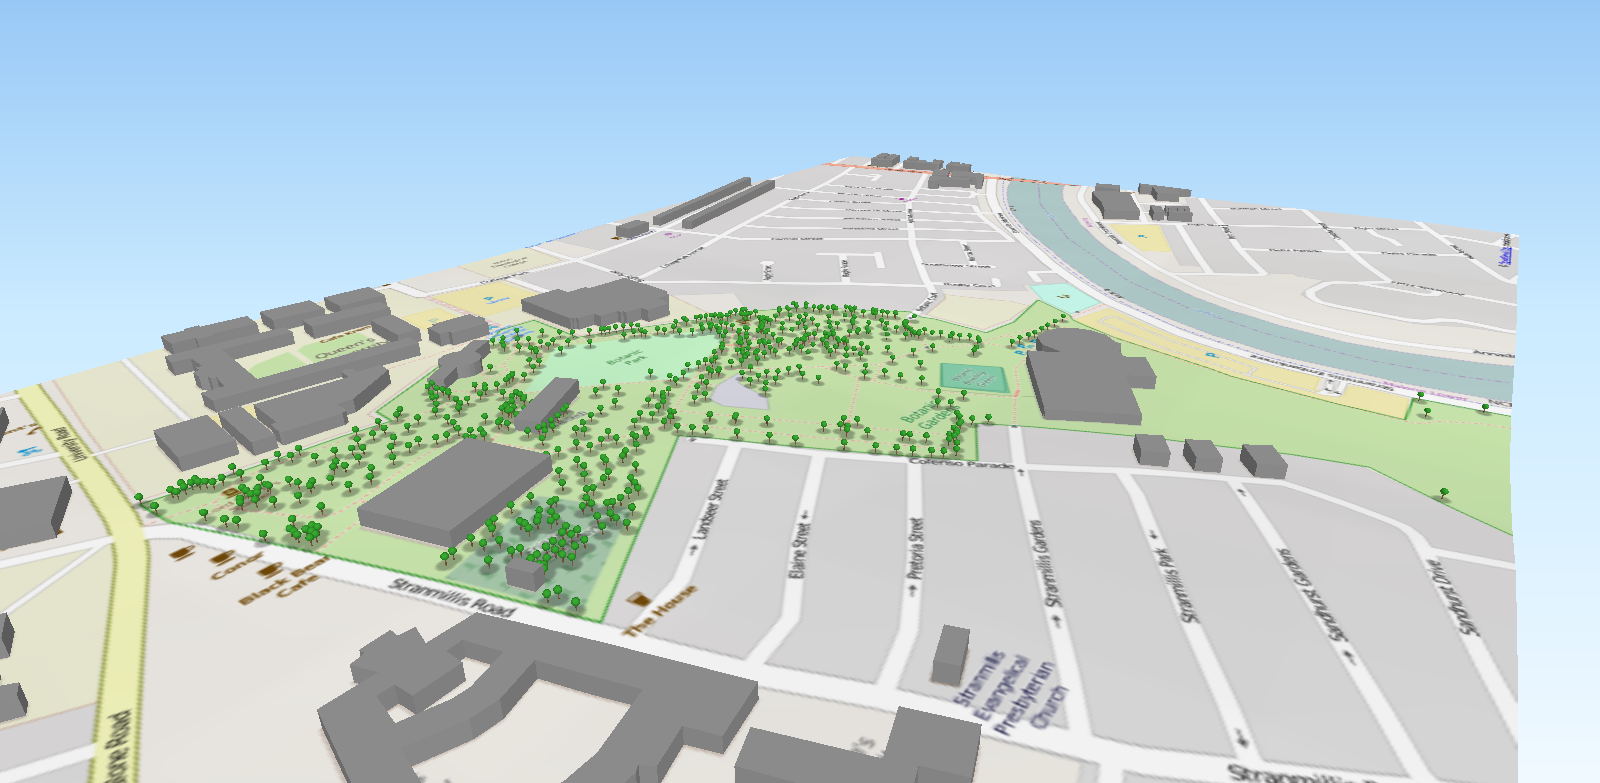
Image created from open spatial data and methods by Lorraine Barry, GIS, QUB
Figure 3
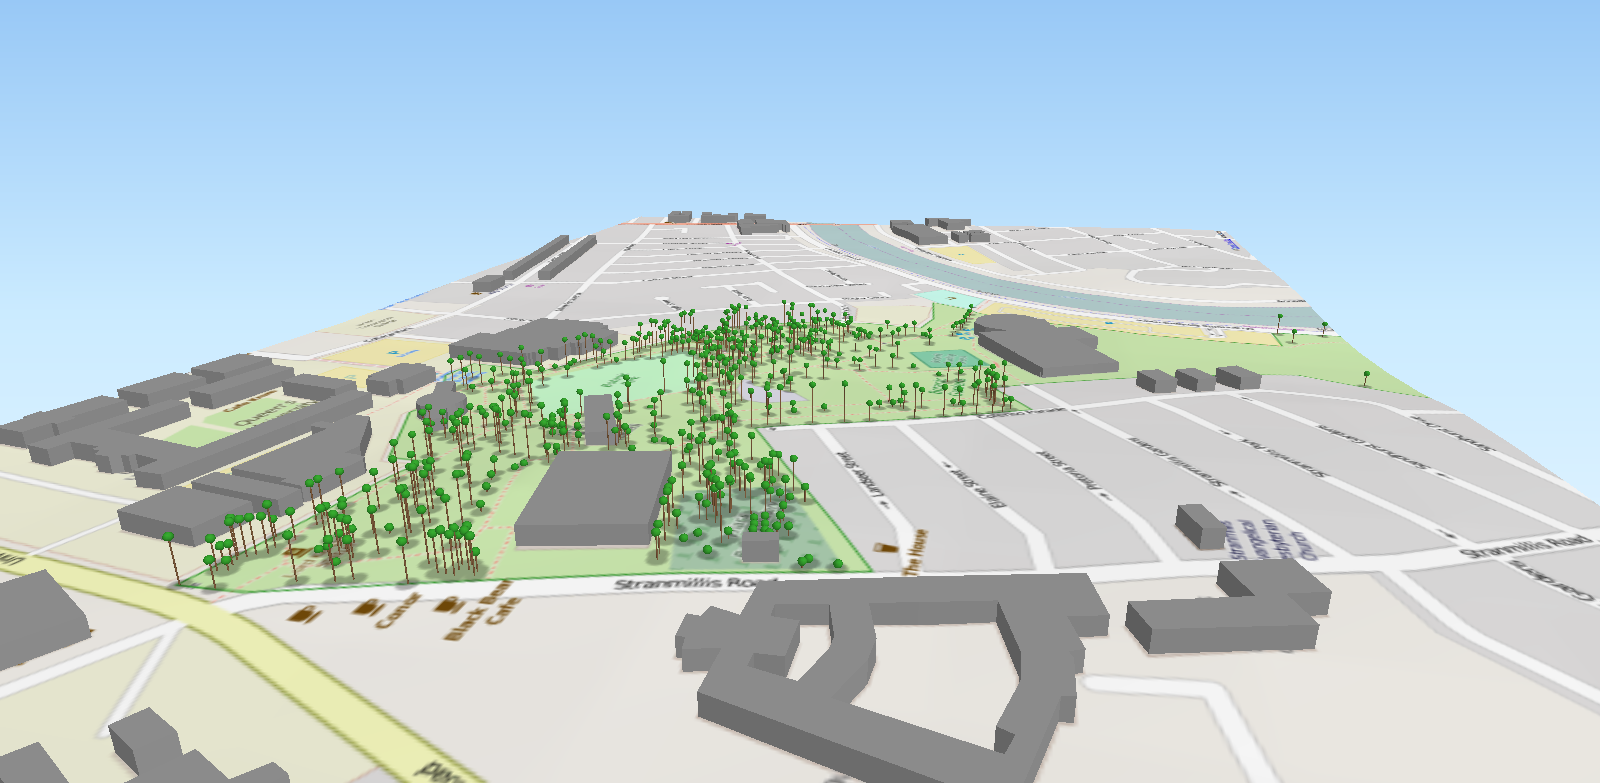
3D Open Source Visualisation of Trees in Botanic Gardens with Tree Height created by Lorraine Barry, GIS, Queen’s University Belfast.
Interactive link to this model based on recorded tree heights.
Interactive link to this model based on a standard tree height.
Application of such visualisations can play an important role in landscape assessment, ecological management, urban planning and sustainability. Opening access to spatial data drives innovation, capacity and creativity within such assessments.
Output 3D models are created in html format and are fully interactive. The visuals presented here have been created using the following open data, software and libraries:
- Belfast City Tree Database (CSV) made available from OpenDataNI https://www.opendatani.gov.uk/
- Elevation Data for the Belfast region from the USGS SRTM (Shuttle Radar Topography Mission) http://earthexplorer.usgs.gov/
- Open Street Map vector data for the city of Belfast. https://www.openstreetmap.org
- QGIS http://www.qgis.org/
- QGIS2threejs plugin https://github.com/minorua/Qgis2threejs
Very Good……Keep Doing This
Thanks David!
Conor.
Thanks David. All open source (except the hosting).
Feel free to get in contact if you have any modelling or GIS requirements.
Lorraine