Dr Will Megarry, Centre for GIS and Geomatics, School of Natural and Built Environment, Queen’s University Belfast
Shetland, 2nd June 2017
[The North Roe Felsite Project has been funded by the National Geographic Northern European Exploration fund]
INTRODUCTION
Global positioning systems (hereafter GPS) are an everyday part of our lives. From navigating in our cars to Google Maps, we use spatially located data regularly and rarely think about the satellites orbiting over our heads and on the horizon. Most of our requirements do not require highly accurate GPS. Our Garmin devices auto-correct to roads and phones record accuracy to the meter precision necessary for finding shops or addresses.

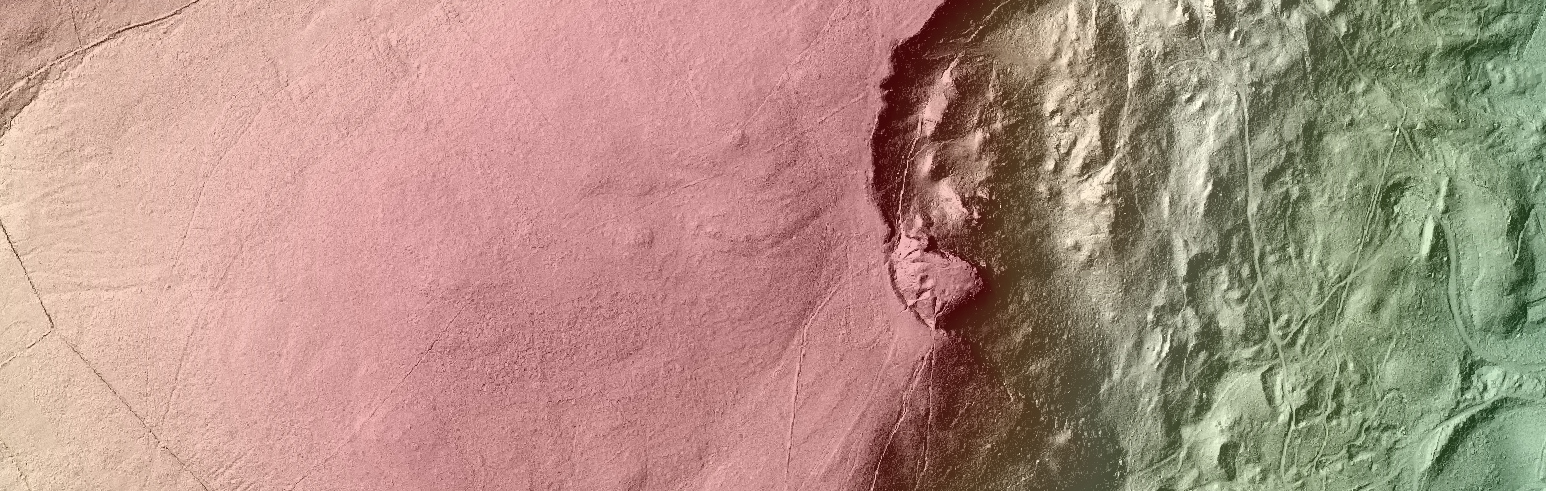
Figure 1: The Shetland Islands (left) and the study area (right)
There are cases where more accuracy is required. Real time kinematic (RTK) GPS, which provides centimetre-level accuracy, is now widely used in archaeological excavations to record the three-dimensional locations of artefacts in complex stratigraphy. It is less widely used for surface surveys where artefacts are rarely fund in-situ (where they were deposited); however, there are some rare cases, where surface preservation is so outstanding, that high-precision GPS recording allow us to explore the detailed relationships between artefacts and sites. This post will explore how RTK GPS has been used to plot the surface distributions of Neolithic artefacts at stone tool quarries in the Shetland Islands. The survey was part of the North Roe Felsite Project, an ongoing study into the extraction, production and distribution of Neolithic polished stone tools across the Shetland archipelago.

Figure 2: Stone axe roughouts (Photo by Megarry 2013)
THE SHETLAND ISLANDS IN THE NEOLITHIC PERIOD
Shetland is the northernmost part of Europe where farming is practiced in the Neolithic (Figure 1). The traditional elements of Neolithic society (animal husbandry, arable agriculture, distinctive stone tools) arrived later to Shetland than elsewhere in Britain and Ireland. Neolithic society then evolves largely in isolation, resulting in distinctive and unique regional styles of material culture. This is clearly seen in the production of polished stone axes and knives, the latter being unique to the islands. The vast majority of these were quarried from a distinctive blue-grey stone called felsite which was extracted from long linear dykes in the landscape. Extraction was focused on a series of workshops in the exposed Northmavine region, on the slopes of Shetland’s highest point – Ronas Hill. The remote situation of these sites has resulted in exceptional preservation, where the quarrying process remains visible in the dense surface scatter of debitage (waste material), produced during the quarrying process, where large blocks of felsite were removed from the dykes using large hammerstones, placed away from the quarry face, and turned into teardrop shaped objects called roughouts (Figure 2) which are later polished down to make stone axes. Broken roughouts can be identified in the debitage material along with other distinct artefact types. The area was intensively surveyed and the exact locations of artefacts surveyed using RTK GPS (Figure 3). These exact locations allow us to perform some point pattern analysis of artefact distributions.

Figure 3: RTK GPS survey in a strong north wind! (Photo by Gilhooley 2017)
POINT PATTERN ANALYSIS
Point pattern analysis is reliant on accurate data. This means that your point dataset (artefacts) should either be a complete collection or be a representative sample of the overall population. Surface material is, by its very nature, less resilient than excavated deposits. It is prone to weathering and disturbance by geomorphological and human factors. While the levels of preservation at the workshops is exceptional, there will have been some disturbance. Plotting the exact locations of artefacts allow us to explore interesting questions about the quarrying process and whether patterns in the data are significant or essentially random and caused by disturbance. We are also able to explore whether different activities are happening at different parts of the site for example, whether larger hammerstones (which were used to remove felsite from the dykes) are found closer to the quarry face? Recording the precise location of different artefact types will also allow us to explore any relationships between artefact types. For example, are smaller hammerstones and roughouts found together? The accuracy afforded by RTK GPS allows us to explore these questions in detail and the result is a point dataset which can be analysed in a geographical information system. There are many tools which allow us to explore the distribution of points in a GIS and these are widely used in a range of fields from ecology to crime mapping. Most explore whether distributions are clustered or dispersed. Simple tests like Clark-Evans nearest neighbour test can be used to explore the clustering of a specific artefact type based on their nearest neighbouring point, while more advanced techniques like Ripley’s K Function can explore degrees of clustering or dispersal over a range of distances. This can be very useful when you do not know the boundaries of your study area. Raster density or ‘hotspot’ maps are often used to visualise clusters of point data. These models are essentially predictive, filling in gaps between points based on surrounding point densities. There are many ways to do this but kernel density estimation is a popular and robust approach which calculates the density of other artefacts within a set circular neighbourhood (or radius) of each artefact. Earlier seasons recorded the distribution of artefacts across the core area of the site and preliminary analysis of this data is promising (Figure 4). More detailed study requires establishing more definitive boundaries and collecting a more complete dataset from the entire site. Patterns of clustering and dispersal are always scale dependent and completing a total survey of the area allows us to set spatial limits to our analysis. These were the goals of this year’s survey.

Figure 4: Kernel densities of different artefact types at 10 m (Figure by Megarry et al 2016)
GETTING STARTED WITH POINT PATTERN ANALYSIS
Analysing point datasets does not need to be overly complicated. Many basic GIS tools like buffering or distance matrices can provide fascinating insights into the distributions of points over an area. Open source GIS programs like Quantum GIS (a favourite on this blog!) offer excellent tools and can be downloaded for free. Tools like buffers and hotspot analysis can be accessed through the vector analysis toolbar while more advanced spatial statistics require some use of R-Statistics. In ArcGIS, basic tools can be found in the analysis toolbox. More advanced approaches, like nearest-neighbour analysis or raster surface densities can be found in the spatial analyst or spatial statistic toolbar. Just remember, these tools are only as good as the user so use them with care! Set your research questions first, prepare your data carefully, think about your parameters, and then begin your analysis!
_____________________________________________________________________________________
The North Roe Felsite Project team are Prof Gabriel Cooney, Dr Will Megarry, Dr Rob Sands, Bernard Gilhooley, Brendan O’Neill, Dr Astrid Nyland, Dr Mik Markham, Dr Vin Davis, Dr Torben Ballin and Dr Alison Sheridan.