To mark the centenary of the holding of the first Census of Population for Northern Ireland on 18-19 April 1926, the Northern Ireland Statistics and Research Agency (NISRA) has compiled a statistical bulletin comparing the demographic statistics of that census with the most recent 2021 census. In the following essay Professor Marie Coleman (HAPP) looks at the historical context of the 1926 census and the factors which have influenced change in Northern Ireland over the past century. NISRA’s statistical Bulletin can be accessed by clicking here.
The background to the 1926 census
The population censuses held in both Northern Ireland and the Irish Free State on 18-19 April 1926 provide a valuable insight into life in the two new jurisdictions on the island five years after their creation. While a post-war census was held in England & Wales and in Scotland in June 1921, this was not possible in Ireland due to political unrest and delayed censuses were held in April 1926.
Religion
A significant difference between Irish and British census was the recording of religious affiliation. This was first asked in Ireland in 1861, though not in England & Wales or Scotland until 2001, where there was one overall category for ‘Christian’, rather than the Irish denominational breakdown. In the 1926 Northern Ireland census this question was optional (and it remains so) though there seems to have been a fairly high response rate.
The figures for religious affiliation showed that while the population of the six counties had increased marginally to 1,256,561 – up from 1,250,531 in 1911 – the number and proportion of Catholics had declined noticeably, with 9,733 fewer than in 1911. Catholics still comprised slightly over one-third of the population. There was a corresponding increase of almost 12,000 Episcopalian Protestants, most of whom identified as Church of Ireland. It is likely that some of the newly arrived members of the Church of Ireland left the south having experienced violence during the revolution or preferring not to remain there after independence. The increase by 7,000 (from 56,000 in 1911 to 63,000) of those born in what was now the Free State is probably accounted for in part by such politically-motivated migration. By contrast the number of northern-born residents of the Free State remained steady at 35,000.
Sectarian violence experienced by Protestants during the War of Independence and Civil War was not the sole reason for this trend, or for the significant decrease by one-third of the non-Catholic population of the south since 1911. The disbandment of the Royal Irish Constabulary and the removal of the British army from the south accounted in part for the Protestant de-population. Economically-motivated migration was also a significant factor. The Free State’s Registrar General cited emigration as a significant factor in the population decline there by 5.3% between 1911 and 1926.
Nationalists and the census
Some concerns had been raised of a potential nationalist boycott of the census as a form of civil disobedience in opposition to partition. By contrast, The Irish News, urged ‘[e]very Catholic Householder’ to ‘utilise the “Religion” column scrupulously and fully’. The timing of the census a year after the failure of the Boundary Commission to alter the border made it more important than ever to highlight what nationalists saw as the unfairness of partition.
One factor which might have induced nationalist non-co-operation was the deployment of the Royal Ulster Constabulary (RUC) as census enumerators. Over 1,000 RUC constables were engaged in census collection (as were 2,000 Gardaí in the Free State), making it one of the new force’s largest civilian mobilisations. The most extreme example of such fears was a British newspaper report that a nationalist farmer from Dromara shot himself thinking that the police had arrived to arrest him.
In a recognition of nationalist distrust of the police and in order to ensure that this did not hinder engagement with the census, a special provision was made ‘to enable persons, who might be reluctant to disclose particulars to some other person required to make a census return [i.e. a police constable] to make a separate confidential return’. According to the Registrar General the number who availed of this dispensation was ‘relatively small’. The RUC was retained as the principal census enumerator, saving the Ministry of Finance a sizable expense, until the 1960s when political unrest gradually led to the police being replaced by civilians.
The question of nationalists boycotting the census in Northern Ireland did not arise until the start of the Troubles. Laurence Cooley’s research has shown how campaigns of civil disobedience in both 1971 and 1981, partly as a rejection of the census as an apparatus of the state and in the latter year against the backdrop of the hunger strikes, have limited the reliability of some of the data collected in those years. This is especially so in regard to the question of religious affiliation, which had a non-completion rate of 18.5 per cent in 1981.
Irish language
Ten years later, by 1991, a change in republican political strategy and the increase in the size and proportion of the Catholic population produced greater nationalist engagement to highlight the size of the Catholic and nationalist population and agitate for better resourcing in their areas. Another factor which likely encouraged greater nationalist engagement with the 1991 census was the inclusion of a question, at the behest of the Irish government following the Anglo-Irish Agreement, on proficiency in the Irish language.
This question had been included in the Irish census since 1851 and was retained in independent Ireland. Notably it was dropped from the first Northern Ireland census in 1926. There may have been a view that the form was long enough already or that the response rate would be so negligible as to render it superfluous. Apart from County Tyrone, where 5.3% could speak Irish in 1911, the figure for the remaining five Northern Irish counties varied from 1.2% in County Down to 2.9% in County Derry/Londonderry.
Nevertheless, the exclusion of the question on Irish was clearly a political statement by the new Northern administration. The Registrar General, L.A. Bullwinkle, noted that the omission brought Northern Ireland ‘more into line with the decennial censuses taken in Great Britain’. In making this statement he clearly was thinking only of England, as questions on speaking Welsh and Scots Gaelic had been asked in the censuses collected there since 1881. If anything, the exclusion of the question on Irish set Northern Ireland apart from Great Britain.
Post-war demography
The slight population increase in Northern Ireland, which was smaller than a similar increase in England & Wales recorded in 1921, might seem surprising in the aftermath of a decade of war and the 1918 influenza pandemic. The impact of war-time losses, and excess mortality from the influenza pandemic (Patricia Marsh has estimated that the highest number of influenza deaths, approximately 7,000, was in the province of Ulster) is more visible in specific categories.
The disruption to family life caused by the absence of men at the front led to a decrease in the birth rate between 1916 and 1919. In Northern Ireland by 1926 this resulted in fewer children (931) recorded in the 5-to-9 year-old age bracket than any other age category for those under 15. By contrast, demobilisation resulted in a noticeable post-war baby boom among those aged 0-4, of whom there were 1,017 in 1926.
These figures also reflect lower infant mortality rates immediately after the end of the war than during it, as food supplies and consequently standards of nutrition improved. Nevertheless, infant mortality rates remained stubbornly high, especially relative to England & Wales, until the end of the twentieth century. The highest level of infant mortality in Northern Ireland – 85 deaths per 1,000 live births – was recorded in 1926. This was close to the Scottish figure (83) but noticeably higher than that of the Free State (74) and England & Wales (70). By 1980 the figures in all jurisdictions had reduced to 11 (Republic of Ireland), 12 (Great Britain) and 13 (Northern Ireland). In the second half of the twentieth century the improvement of health care, social services and housing after the Second World War brought a marked improvement.
Gender
A particular feature of the 1921 census for England & Wales was the so-called ‘surplus women’, with women outnumbering men by a ratio of 1,096 women to 1,000 men, and in Scotland the figure was
1,080 : 1,000. This result of war-time mortality had produced a differential extension of the franchise in 1918 with women enfranchised at age 30 and men at 21 in order that women would not outnumber men in the electorate.
Northern Ireland appears to have had fewer ‘surplus women’, with the ratio of women to men recorded in 1926 as 1,066 females to 1,000 males, though the excess of marriageable females to males in the 35-44 age cohort – that most affected by military service – had increased by 1,353 from 1911. The overall difference between Northern Ireland and the rest of the UK possibly reflects the absence of conscription in Ireland. The Free State had the opposite problem of surplus men, where there were only 972 females to every 1,000 males, a reflection of the high level of emigration by single women.
Age
One area where data on women in Northern Ireland in 1926 is unreliable is that of age. In advance of the census being undertaken the Irish News speculated that ‘the question of age’ might prove ‘a stumbling block to the gentler sex’, who, once ‘past their teens … have a tendency to slice off a margin from their actual age’, a margin which ‘grows more liberal with advancing years’. These predictions appear to have been realised, though not solely in regard to women. The Registrar General grudgingly could not ‘avoid being impressed by the degree of misstatement which appears to have been shown in the matter of the recorded ages of persons’.
With civil registration not having been introduced in Ireland until 1864, ‘an appreciable number’ of respondents were only able to give their age in years and not in years and months as asked on the census form. Nevertheless, the Registrar General felt reporting of age had improved overall in 1926. Admittedly it would not have been hard to be an improvement from 1911 when a significant number of those who claimed to have been 70 in 1909 to avail of the new old age pension appear to have maintained that fiction two years later.
Education
One of the most dramatic changes in a century of Northern Irish life has been the improvement of educational attainment. In 1926 schooling until age 13 was compulsory and there was a dramatic decline in participation thereafter, with only 55% of 14-year-olds and 28% of 15-year-olds remaining in education. The inflection point for continuing education into later teenage years came in Northern Ireland after the Second World War with the introduction of Colonel Hall Thompson’s 1947 Education Act which introduced the 11+ and raised the leaving age to 15.
The effects of this were clear by 1956 when more than 200,000 children were in post-primary schools, compared to just 13,800 in the late 1930s. Participation in tertiary education in Northern Ireland in 1926 was miniscule, with only 2% of 20-24 year olds in education, mostly at university, seminaries and teacher training colleges. By 2021 almost one-third of the same age cohort remained in education.
Change over a century
By 1926 the lingering impact of the First World War upon Northern Irish society was visible in demographic data on births and gender ratios. Some of the biggest changes which differentiate Northern Ireland today from what it was one hundred years ago, came in response to the second great war of the century. In the United Kingdom this resulted in significant legislative changes to health, education and social services. These produced a gradual improvement, throughout the latter half of the twentieth century, in levels of participation in education beyond primary school and improved standards of health which saw a reduction in mortality rates among some of the more vulnerable age cohorts. Census taking will continue with the next due in 2031. These are valuable historic records that offer a window into understanding our past.
Sources
Cooley, Laurence. ‘“It will do no more than annoy the Protestants”: the 1991 Northern Ireland census and the Irish language’, Nationalism and Ethnic Politics, 28:3, 269-289 (2022)
_____ ‘“No status – no census!” The causes and consequences of the 1971 and 1981 Northern Ireland census boycotts’, Contemporary British History, 39:1, 105-142 (2025)
Kennedy, Liam and Philip Ollerenshaw (eds) Ulster since 1600: politics, economy, and society (2013)
McBride, Orlaith and John Gibney (eds), The story of us: independent Ireland and the 1926 census (2026)
Marsh, Patricia. The Spanish flu in Ireland: a socio-economic shock to Ireland, 1918–1919 (2021)
Ó Gráda, Cormac. ‘The political economy of the old age pension: Ireland c. 1908-1940’ UCD Centre for Economic Research Working Paper Series (2000)
White, Ian. ‘A brief history of the census in Ireland/Northern Ireland’, chapter 2 in Registrar General Northern Ireland, Annual Report (2011)
About the Author
Professor Marie Coleman is a Professor of Twentieth Century Irish History at Queen’s University Belfast.
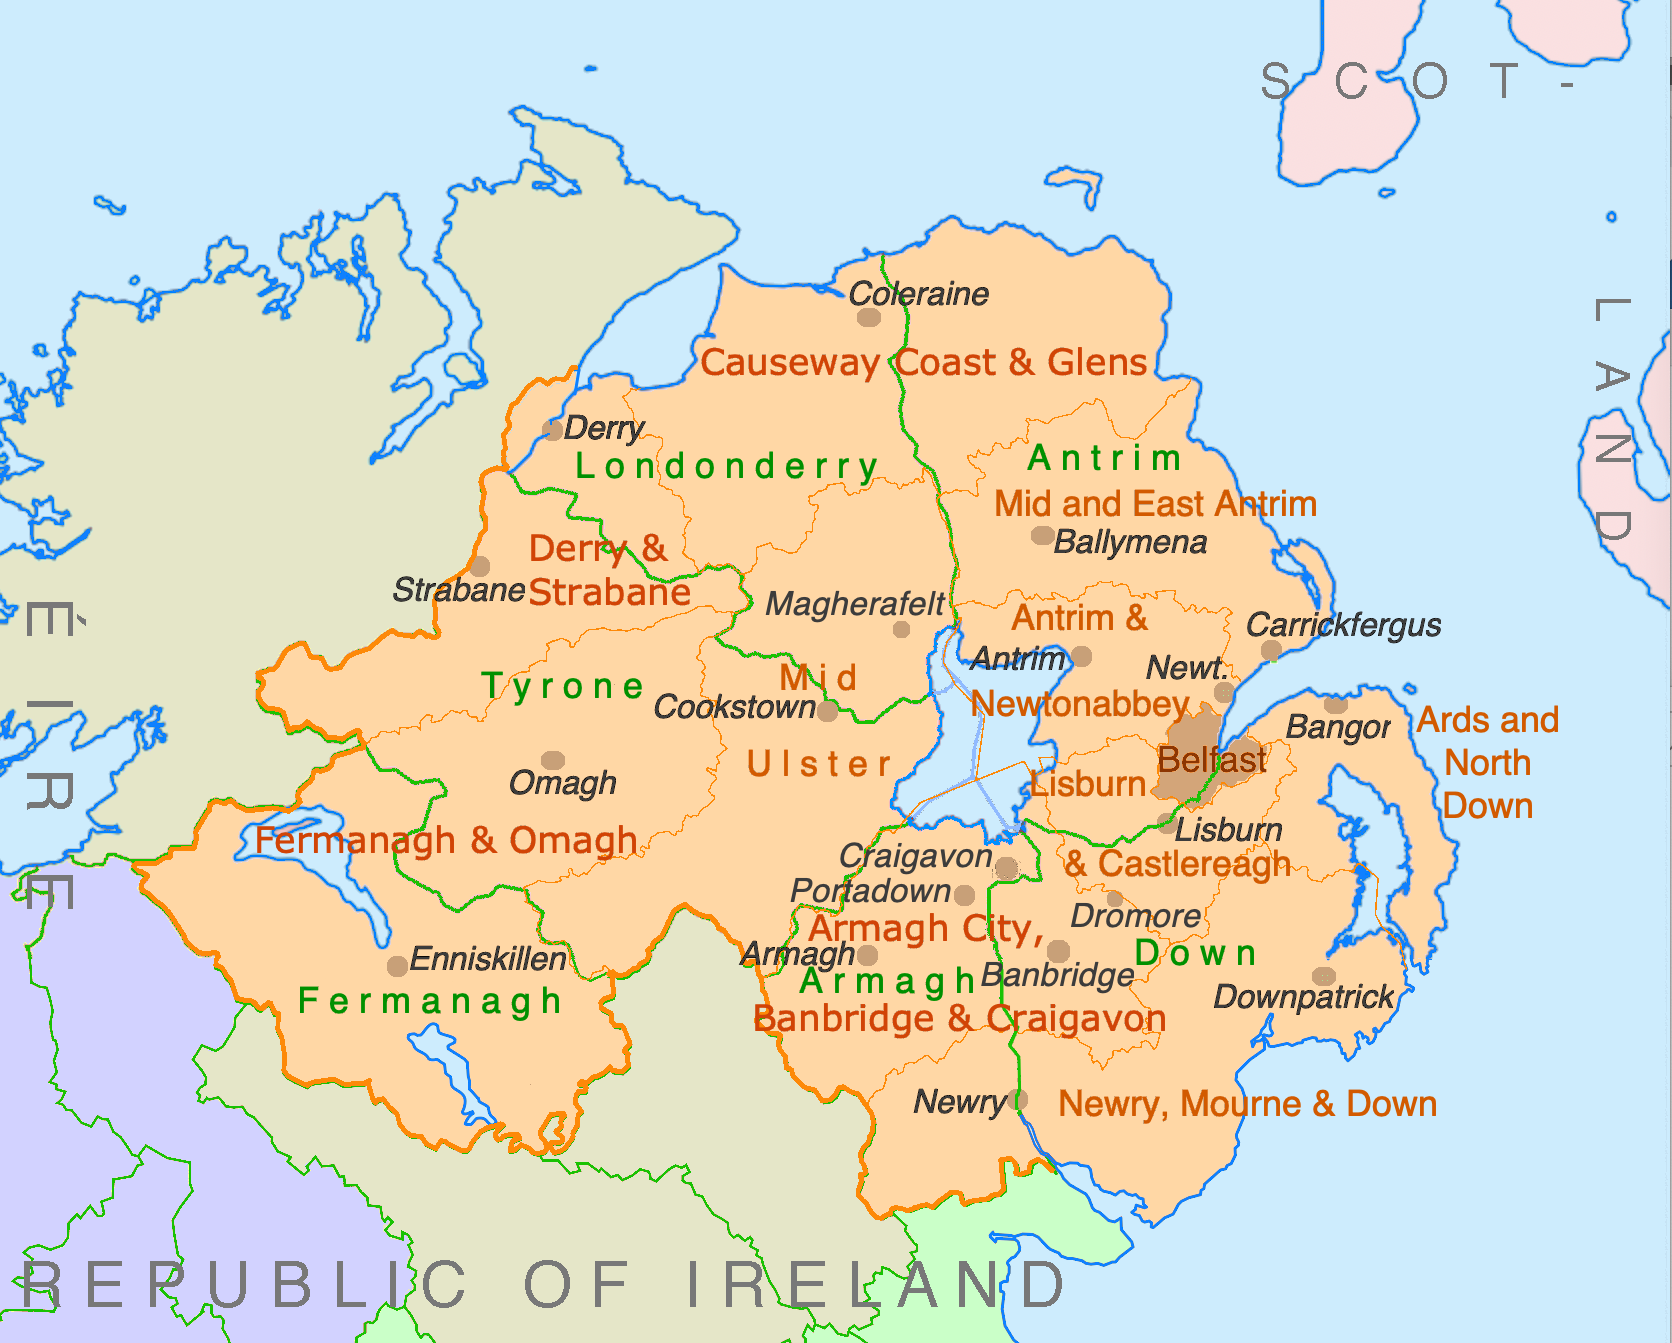
Featured image courtesy of a Creative Commons License – Ulamm, CC BY-SA 4.0 via Wikimedia Commons
Leave a Reply