SoundCloud Discussion with Bereavement Coordinators

The Grief Study is now on SoundCloud. You can go to soundcloud.com/griefstudy to stream or download our two-part discussion with two members of the Northern Ireland Health and Social Care Bereavement Network, Carole McKeeman (Western Trust) and Anne Coyle (Southern Trust). Or you can listen from the embedded links below.

In part 1, we discuss the role of Bereavement Coodinators within the Health and Social Care Trusts. We then focus on results from the Grief Study comparisons of relative mental health impact of different circumstances of bereavement.

In part 2, we look at the different mental health risk profiles of particular bereaved groups within the population, particularly those with different educational backgrounds and those who provided unpaid care to a relative prior to their passing.

Posted in Uncategorized | Leave a comment

The Grief Study Research Seminar

We will be presenting some of our findings at Queen’s University Belfast School of Sociology, Social Policy and Social Work school Seminar Series on Thursday the 3rd of April.

We’re also hoping to record some audio material for The Grief Study Podcast, and meet with some of our stakeholders to discuss the research.

The event is free to attend and open to everyone. We hope to see you there.

GRIEF STUDY Research Seminar April 2014 Flyer

Posted in Public Discussions | Leave a comment

DAG Blog Part 2: Identifying Confounders for Grief Effects

In this study, we are testing the hypothesis that bereavement causes poor mental health. There are lots of confounding factors, but after accounting for these confounders, our hypothesis states that there is still a causal effect. Our study is trying to identify the best estimate of the size of the effect of bereavement on mental health; i.e. does bereavement increase the risk of poor mental health and, if so, is the risk doubled, trebled, or some other value, compared to the risk of mental health for those not bereaved.

In Part 1 of this post, we outlined our understanding of the problem of confounding and gave one example of how a confounding factor, poor physical health, might confound the causal relationship between bereavement and poor mental health and cause an estimate of this effect to be biased. We also explained the use of DAGs (Directed Acyclic Graphs) in the context of identifying confounders.

In this part, we will show you the DAGs we have produced to frame analysis in the Grief Study. We are very keen to receive feedback on these models. If you think we’ve gotten something wrong, if we’ve missed out anything in the diagrams, if we’ve put an arrow in the wrong place, or if there’s anything else that we should include, we’d really like to hear from you, so please send one of us a message, or comment below.

The first variable we needed to deal with was age. Mental health risks vary across the lifespan and risk of being bereaved of someone close to you, such as a spouse, partner or parent, increases steadily as you get older. We decided to group our analyses into three broad age bands “Youth and emerging adulthood”- 16-24; “Working age”- 25-64; “Retirement Age”- 65+. The set of variables identified as confounders is slightly different for each of these groups. For example, while women of working and retirement age are more likely to be bereaved because of the shorter average lifespan of men, we argue that young persons are equally likely to be bereaved regardless of gender. Most bereavement in this group will be of parents or grandparents, gender of the bereaved child doesn’t affect their risk of bereavement.
(As described previously mental health outcomes are available from 2009 onwards. Age groups are derived from the 2001 census, i.e. persons who were 8-16, 17-56 and 57+ in 2001.)
Let’s begin in the middle with the largest group, working population. This is also the group for whom the fullest range of variables is available, as educational attainment and economic activity will not have been collected in 2001 for the youngest and oldest members of the sample.
Working Age

Gender: Women are at increased risk of poor mental health and are also more likely to experience a loss, as men as more likely to die than women.

Age: While models are already stratified by age, being older within this age group continues to contribute to the likelihood both of poor mental health and of being bereaved.

Household composition: The make-up of the household mathematically affects the probability of being bereaved: more co-residents/family members increases the likelihood of bereavement. Household composition and parental marital status also affects children’s mental health.

Individual health is likely to be related to risk of bereavement, as cohort members are likely to experience shared lifestyles and risky behaviours with their co-residents. Congenital conditions will also have familial link. Physical illness is known to be associated with poor mental health regardless of age. Similarly, suffering from a Limiting Long-Term Illness (LLTI) is known to be associated with poor mental health and may an indicator of congenital/prenatal household malaise.

Carer Status: Having to provide unpaid care to a relative may be a risk to an individual’s mental health. Those in caring roles are also likely to be bereaved as this indicates that someone close to them is ill or disabled to the point of dependency. Carer status will be controlled for as a confounder, but further analysis will look more closely at whether having cared for the deceased either intensifies or softens the effect of the person’s death.

Socioeconomic Status: Those at greater levels of deprivation are more likely to suffer bereavement due to lower levels of general health and barriers to resources. The same factors account for worse mental health in deprived households and areas. House value and tenure, Household Car Access and Area-level deprivation are used as indicators for household affluence. We are making the assumption that being in a deprived area causes house value to be lower, and being in a lower value house is an indicator of affluence. House value, access to cars and socioeconomic classification (NSSEC) will be used as individual-level indicators of socioeconomic status which is known to be associated with both risk of bereavement and risk of poor mental health.

Members of different religions have also been shown to have different levels of lifespan expectancy and mental health problems, therefore an indicator of religion is included in the model. Note that religion, education and caring may all moderate the effect of bereavement on mental health (either increasing or reducing the risk of mental health consequences). We will post subsequent blogs on how effect modification can be integrated into our DAG framework.

We omit indicators of urban or rural dwelling on the basis that while this may affect mental health, it is not associated with risk of bereavement.

You may recall from our introductory blog that our proxy measure for mental health problems is prescription of antidepressant, anxiolytic or hypnotic drugs by one’s General Practice. GP practice is included in red in these diagrams to highlight that analyses will be clustered to allow for idiosyncratic variation between individual practices.

Generally, the arguments for this group carry across to the retirement age group. The most notable variables included in the working age DAG and excluded from the retirement age DAG are those which are unavailable for the full age range of the sample, namely Education and Socioeconomic Status (for which the NSSEC indicator is derived from job type).
Older age
For young people, we suggest that some differences to the model of confounders applied to adults.
Younger age

Omitted from this model are gender, age, religion and general health. Young females are no more likely to be bereaved than young males, as the type of bereavement one is most likely to experience as a young person is not of peers but of parents and grandparents. We also submit that likelihood of bereavement varies little between the ages of 16 and 24. Religious differences in bereavement likelihood also apply to lifespan expectancy at older age groups. The census general health question is less likely to be related to risk of bereavement for young people, as cohort members are too young to experience shared lifestyle health with their co-residents.

As stated in the opening of this blog, we are keen to receive feedback on the integrity of these models and whether or not you are convinced by the reasoning for inclusion and omission of variables. We encourage readers to seek more information on Directed Acyclic Graphs and their applications, as we have found them to be tools in the greater toolbox of Quality Thinking; tools which aid clarity of thought and identification of causality. Ultimately we hope that this approach will make our results more accurate, robust and fit for the purpose of informing how we, as a society, help bereaved people to better cope with loss.

Posted in Uncategorized | Leave a comment

DAG Blog Part 1: Understanding Confounding

Epidemiology, the science of understanding disease, can offer much guidance to those wishing to understand how different people experience different levels of emotional hardship. As such, the Grief Study has been trying to keep pace with recent developments in one particular problem set of Epidemiology, namely how to isolate the effect of one particular exposure category on one particular outcome.
The Grief Study is attempting to isolate the effects of bereavement on mental health problems. In our study, bereavement is the exposure variable and mental ill-health, the outcome. The key danger we are trying to minimise is that of confounding, that is to say mistaking the effect of some other influence on mental health for that of bereavement.
Here’s an analogy. Imagine you wanted to examine the effect of drinking coffee on the risk of developing cancer. Here’s how we might phrase this: What is the additional likelihood of having developing cancer incurred by being a coffee-drinker versus not being a coffee-drinker?
Coffee1
In effect we’re trying to assess (a) whether there’s enough of an effect to justify there being an arrow between coffee and cancer and (b) the size of that effect. (We might imagine that the stronger the effect, the thicker the line we would draw.)
So to examine this, we take information on coffee drinking and cancer diagnostic history for a sample of people. Say we do this and find strong evidence for coffee drinkers suffering more often from cancer, e.g. twice as many coffee-drinkers suffer as non-coffee drinkers. However, we could not submit such a conclusion, until we first considered the possibility of confounding.
We would consult with the literature on other known causes of cancer and consider. Here, the risk of cancer to cigarette smokers is an example (and probably Epidemiology’s most famous discovery). We might reason, coffee drinkers may be more likely to smoke cigarettes and vice-versa. Therefore, any estimate of the risk to coffee drinkers which did not also consider the risk to of cigarette smoking would inevitably be misleading.
Coffee2
The statistical methods to deal with these types of problems within models such as multiple regression or multilevel analysis are established and evolving continuously. You could even argue that the issue of identifying confounding is more of a challenge to imagination, quality thinking and awareness of existing literature than to statistical skill per se.
The diagram above is a very basic example of a Directed Acyclic Graphs, or DAG. DAGs are tools used to map out the influence of interest alongside other related influences. This involves identifying confounder factors which influence both likelihood of exposure and likelihood of outcome. Those confounding effects can then be modelled statistically so as to remove any bias from the main effect of interest.
Returning to the problem at hand and the effect of interest in the Grief Study, the effect of bereavement on mental health problems:
Bereavement0
As with our first example, we can quickly think of confounding effects. For example, having poor general health increases likelihood of poor mental health. It is also associated with poor household-level conditions such as poor diet and lack of home insulation. These are known risks for mortality and therefore also increase risk of bereavement.

Bereavement1

Therefore, when planning our analysis, one of the factors we need to account for is physical health.
In part 2 of this post, we describe the various DAGs we’ve used to frame our analysis in the Grief Study. These may look quite complex at first glance, but the building blocks are the same as above: a network of factors existing influencing either bereavement or mental health problems. Our challenge is to first identify those factors affecting both, and to specify the pathway by which they could confound the estimated effect.

The above serves as a basic introduction to the idea of confounding and the application of DAGs to this problem set. If you have any good examples to share with us, or believe we could be more clear in our explanation, please comment or contact us.

Posted in Uncategorized | Leave a comment

The Mourning After: An Analysis of the Effect of Bereavement on Mental Health

Presentation at the Institute of Public Health in Ireland Open Conference on October 8th, 2013

AM_IPH

Aideen Maguire presents preliminary findings from the Grief Study. Slides are available at:
http://www.iphopenconference.com/sites/default/files/slides/s3t4.pdf

Posted in Uncategorized | Leave a comment

What Happens After Skippy Dies? John Moriarty Speaks to Author Paul Murray about Writing Scenes of Grief

“ ‘I’m forgetting what he looks like’, the boy says huskily… ‘Every day more pieces are gone. I’ll try and remember something and I won’t be able. It just gets worse and worse. And I can’t stop it’ … then, right in front of Howard, he punches himself in the head with his fists, hard as he is able, then again, and again, shouting over and over, ‘I can’t stop it! I can’t stop it!’ “

The image of any young person visibly breaking down and losing control is jarring in any context. In the context of Paul Murray’s Skippy Dies, what gives this scene in Ed’s Doghnut House its power and poignancy is the realisation the grief of the young man, the yawning absence of his best friend, allied with the trauma of having watched him collapse of an overdose, is the first set of circumstances which 14-year-old Ruprecht has been utterly unable to control in his own mind. Hitherto, the universe has been a series of logical conundrums, each more beautiful and fascinating than the last. String theory, M theory, the eleventh dimension each excites him in a way strange and foreign to his classmates. But what use is any theory that can’t account for how a person’s whole existence vanishes in an instant and which provides no route to restoring that existence.

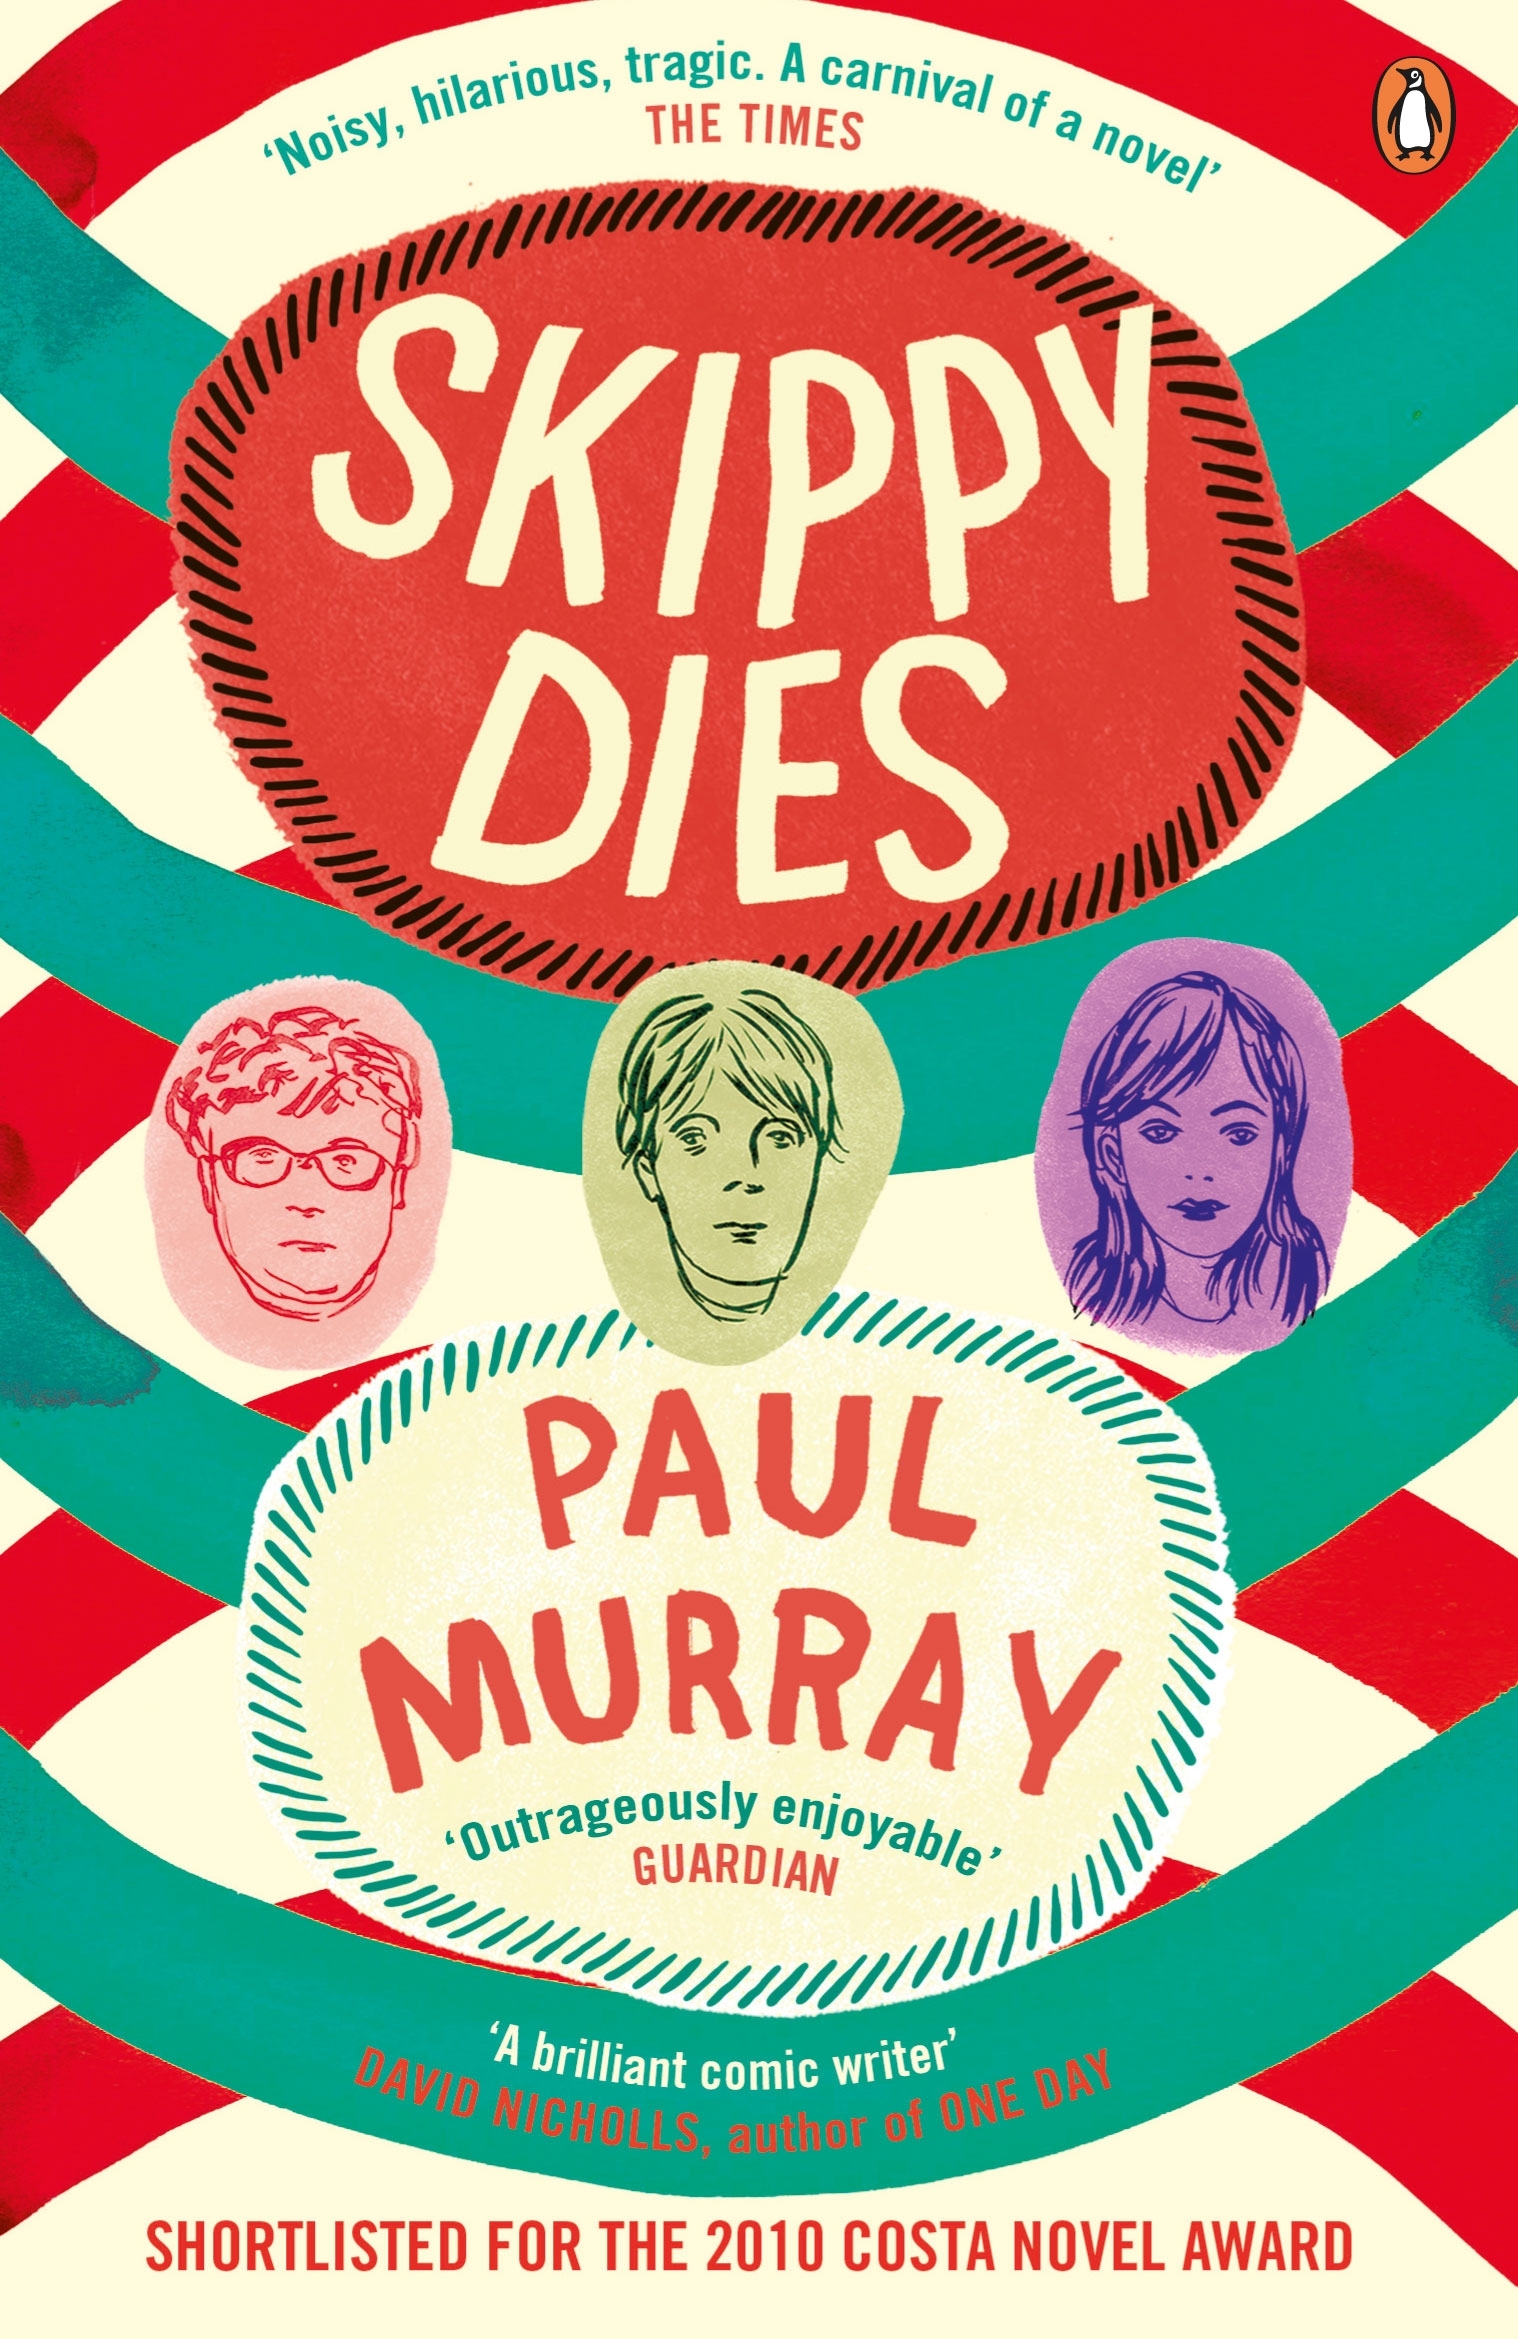
You might not expect to learn much as to the nature of death, grief and the challenge they pose to our ability to make sense of the world from a book described on its cover and most reviews as a triumph for comedic writing. But reading of Skippy Dies and speaking to author Paul Murray leave much to ponder on this and many other facets of our existence. The book shows us, slowly, humorously and forcibly, how the death of the young adolescent Daniel “Skippy” Juster comes to affect a great many lives, young and old. We see this simultaneously through individuals and through groups whose collective flailing and failing attempts at grieving loss and restoring normality steer us to an important conclusion: how a person sets about making sense of such a profound event as death speaks to the whole of the culture they inhabit.

Murray contends that death is unique in exposing most fully how deficient our view of the world can be. “All of the characters subscribe to some universal explanation of how the world is. Skippy has his computer game; Howard (the boys’ history teacher) has his studies of the First World War; and Ruprecht, most obviously, has M Theory. These are all ideas which the person thinks holds the key to understanding everything. My suspicion is that, ultimately, any objective system of understanding the world will be no use to you as a subjective being.” Behind his loss of composure and outbreak of fury in Ed’s Doghnut House, Ruprecht is not just mourning a person, but saying a bitter farewell to a scheme and a logic which not only has served him as a tool, but has allowed him to form a convincing persona and self-definition.
Of course, not every character falls apart so swiftly and completely. “I didn’t want everyone to have this instant epiphany and become this profound and introspective person just because of this experience. It doesn’t happen like that.” Skippy’s femme fatale, Lori, the recipient of a declaration of love which becomes Skippy’s last earthly act, is cast into the spotlight of the media by the Tragic Event. This is the same spotlight she and her parents have desired for her to be under since she began to blossom and set her sights on TV modelling. Before she knows it there is talk of screen tests.
“Dad sits back and rests his hands behind his head. Something good may yet come of all this, he says contentedly. And you deserve it too, after all you’ve been through.”
“W.H. Auden has a quote about how every artist is craving tragedy in their lives. I think when something tragic happens us, we do tend to milk it a bit. We’re all looking for this little badge of authenticity to make us seem more real. In Lori’s case, grief becomes a kind of social capital and that’s what she uses it for. I don’t think she realises the way that it’s hit her until later on.”

Among Skippy’s friends, rifts appear very quickly as each takes the loss differently. Frustrated by his denial and persistence with science as the solution, Dennis Hoey takes to yelling the word “dead” repeatedly into the face of Ruprecht, even adopting the tune of La Marsaeillaise (“Dead-dead-dead-dead-de-de-dead-dead-dead”), until a flurry of punches arrives his way. As a group, each starts to retreat away.
“It’s as if Skippy has been one of those insignificant-looking pins that it turns out holds the whole machine together.”

The school year is also affected, at first with a silent resolve to say nothing and say nothing about saying nothing, later developing into a collective unrest over rumours surrounding the circumstances of the death. Here, Murray reaches for one of sociology’s big concepts, as the acting principle looks on at the second years’ growing anomie. “If you go to a school like the school in the book, the ethos is that these people know the score, know how the world works and if you’re a smart person, you’ll fall in with this. If you’re a good boy and follow the rules, then you don’t really have anything to worry about, you’ll go up the ladder and you’ll end up at the top. That’s a fiction, a lie and a death is one thing you can’t lie you’re way around. What the kids are realising in the book is that here is something that school isn’t able to fix and whether they cover up the reasons or give them explanations, they can’t change what’s happened.”

And so, to Howard, the school’s not-altogether-secret shame: a failed finance guy returned to the school to a non-vocation of teaching history. Early in the book, he accounts for his involuntary retirement from trading futures in London with the succinct line “Don’t you read the papers? Not enough futures to go around”, essentially the antithesis of the Seabrook College motto. Through a combination of accident and escapism, Howard comes to spend the period of the book becoming steadily engrossed in the First World War, from which he draws endless parallels. The most fruitful vein is that of betrayal, between generations and within families. Promised jobs and opportunities on departure, the surviving soldiers arrived home to find those promises every bit as broken as their lives and bodies, left instead with little but memories of seeing mates cut down in the trenches. Betrayal and lies are all he sees in Seabrook.

In the moments preceding Ruprecht’s visible dissolution in Ed’s Doughnut House, Howard has been responding to the boy’s queries about séance and communication with the dead, a theme he has mentioned in class. He has sketched the involvement of some famous characters, Arthur Conan Doyle and Oliver Lodge, in the movement to advance the technology of séance. Both had lost sons in the War. “This was a world that had literally gone crazy with grief”, Howard explains “At the same time, it was an age when science and technology promised they could deliver all the answers. Suddenly you could talk to somebody on the other side of the world. Why shouldn’t you be able to talk to the dead?” Was it Murray’s intention to juxtaposition science and history beside one another? “I had a chance meeting with an old friend who was researching how the First World War was mourned. When I started to read up on it, I saw that the context of the Victorian era was a lot like our own, in that it was quite materialistic and science and technology seemed to be on the cusp of explaining everything, to the point where people thought God and death could be explained through science. So here’s another example of a society who had it all sussed out and then this huge wrecking ball comes along. The society didn’t have the wherewithal to bring them through this, so we see this astonishing psychic breakdown. One in five people had lost a family member. It was like a boot through the window.”

Losing friends is thought to be the preserve of one’s older years, yet the experience seems all the more salient when mixed into the already tumultuous experience of adolescence. Here, Murray recalls a recent interview in which philosopher Simon Critchley discusses the relationship of youth with death. “Critchley’s point was that when you’re a teenager you think of death solely in terms of yourself. You think, I’m not afraid of dying, I don’t mind doing dangerous things because I don’t feel death is any real threat. But what comes to you much later is that the real significance of death and loss is losing other people. So if you’re still in your teens and someone else is taken out of your life, it seems inconceivable”.
I wondered to what extent Murray drew on personal bereavement to write about its effects on his characters. “In my own experience of grief, it takes a while. It’s like a little black hole that you can’t see but its gravity is pulling everything towards it. It feels like you’re the same person you always were and then you notice you’re acting in very strange ways.” As to whether he draws directly on losing a school friend, he insists this book is fiction. “I did lose a friend in college, which was a really difficult experience. Someone in my brother’s year committed suicide. It feels like it’s sort of in the air, as suicide has become such a problem.” Given that, was it difficult to base a humorous book around such a grave event? “I wrote the book linearly, so just as you read about the death at the start, that was my starting point. There’s a lot of comedy in the book, but sometimes people in oppressive environments use humour to get through difficult situations, so I found it good to work across those different registers.”

The only good reason to put this book down is to laugh, which I often needed to. Yet, for all the relentless and beautifully crafted lines of hilarity, it would be hard to come by such a thorough treatise on some of life’s most grave and serious points, and how seriously we need to consider our limitations as a thinking society. Our grief may often seem like a personal journey, but our capacity to grieve may be a marker of our strength or weakness as a community or society.

Posted in Uncategorized | Leave a comment

A Focus on Suicide.

A leading mental health charity is calling for more to be done to tackle the growing problem of suicide among middle-aged men in Northern Ireland (NI). In 2011, 289 individuals died by suicide in NI of which 75% were men mostly aged between 20 and 54 years. (1) Much of the focus of recent mental health campaigns has been on young adolescent men with the suicide risk in middle-aged men being less well promoted. According to research released by the Samaritans, men find it harder to deal with issues such as unemployment and relationship breakdowns than women do. It is also known that men from deprived backgrounds are more likely to take their own lives than those living in more affluent areas (2).

Another key factor that often gains less attention in health promotion is the wellbeing of those who are bereaved of a loved one following suicide. Whilst the rates of suicide amongst middle aged men in NI is increasing, there is a corresponding increase in the number of people who are left without a husband, father, brother or son. For each person who dies by suicide there could be 6 to 10 family members 3 and a wider group of friends and family who remain to cope with the loss. The Grief Study will be the first of its kind in NI to study the mental health of survivors of suicide. From this study we will be able to determine the effect suicide has on surviving family members and how outcomes may differ depending on an individual’s relationship to the bereaved. This information will provide insight into those most at risk post bereavement and those who should be targeted for support after bereavement by suicide. Whilst work is on-going to reduce suicide rates and improve mental health in NI it is important to remember that the effects of mental health disorders are never localised to the individual, but affect family, neighbourhood and societal structures and hence any improvement to individual mental health will have knock-on improvements for the entire population.

References

1 Suicide Deaths. Key Statistics 2011 as retrieved from http://www.nisra.gov.uk/demography/

2 O’Reilly D, Rosato M, Connolly S & Cardwell C. Area factors and suicide: 5-year follow-up of the Northern Ireland population. Brit J Psych. 2008;192:106–11

3 Mitchell AM, Kin Y, Prigerson HG & Mortimer-Stephens M. Complicated Grief in Survivors of Suicide. Crisis. 2004;25(1):12-18

Posted in Public Discussions | Leave a comment

School’s in for Summer!

It may not be a hot summer, but it will be a busy one. We’ve plans for a lot of travel, summer schools, data analysis and……hopefully some sunbathing.

Since last November, we’ve been speaking to professionals working in bereavement care, reading up on other projects and studies that have looked at bereavement, mental health and mortality, and we’ve been working hard to get the datasets ready for analysis. Next month, we hope to get the last piece of preparatory work completed. We’re going to link information on prescriptions to the NILS database, after that, we’re ready to begin the main phase of analysis.

We also hope that next month will be the start of the summer; while the weather may or may not get any better, the Grief Study team will be taking a break from working on the study, and spending some time travelling. Not just travelling to Glastonbury or NSx Festival (but we’re going to those too), we’ll be travelling to brush up on our research methods, present some of our work so far, and we’re organising some courses too.

On the 3rd, 4th and 5th of June, John and Aideen will be travelling to the University of Bristol to attend a short course; Rates and survival analysis: poisson, cox and parametric survival models . This course will be particularly useful to help prepare us for answering research question 5 ‘To what extent does bereavement confer an increased risk of mortality?’. These statistical models are used to look at events that occur at certain points in time; we can use them to study the time between bereavement and mortality and how this relates to other characteristics. For example, we may expect that people in their 70s or 80s, after their spouse or partner dies may be more likely to die themselves soon after than someone in their 40s or 50s who becomes bereaved. Survival analysis can help us understand the difference between mortality after bereavement that is due to old age, and mortality that is due to the emotional effect of the loss – we’re testing the idea that people can die of a ‘broken heart’. As we also have information on mental health, we can look more closely at the idea of how much psychological pain affects mortality.

On the 6th and 7th June, Mark will be travelling to the British Library in London for an ESRC Secondary Data Analysis Initiative event. This is a chance for the research teams that were funded by the ESRC to meet, share ideas, and discuss next steps for their studies and future research.

On the 13th and 14th June, Mark and some colleagues from the School of Sociology, Social Policy and Social Work will be visiting the Life Course Institute at the National University of Ireland in Galway. The work of the Institute is of relevance to the Grief Study, in that it aims to understand how events at one point in the life cycle can affect individuals across the life course. NUI Galway will also host the UNESCO Child and Family Research Centre International Conference.

At the end of June, Mark will be heading back to the University of Bristol, for a course on Advanced Epidemiological and Statistical Methods. In particular, this course will look at propensity scoring methods, this may enable us to look at the effect of bereavement on mental health outcomes for smaller subgroups – such as people bereaved at a young age, or bereaved due to rare incidents such as violence – and overcome some of the problems that regression and survival analysis models may face when dealing with small numbers of individuals to study.

In July, the ICCR will be organising a course on dealing with Missing Data in quantitative analysis. Mark has been working with the Quantitative Research Methods with Children and Young People Special Interest Group at Queen’s to organise this course, and Dr. Jonathan Bartlett from the London School of Hygiene and Tropical Medicine will be visiting for three days to deliver the course.

The following week, Mark will be back over in Bristol (we like Bristol) for a course on Multilevel Modelling using Stat-JR, and meeting with staff from the Centre for Multilevel Modelling to prepare materials for a course (we like courses too) at Queen’s in September on Multilevel modelling. Multilevel modelling approaches will be important for the Grief Study to take account of difference in prescribing rates across Northern Ireland. There may be some differences in custom and practice of GPs in terms of their use of pharmacological treatments for mental health compared to alternative therapies. Multilevel modelling will allow us to look at the effect of bereavement on an individual’s likelihood of using antidepressants, while also accounting for any variation due to differences between prescribers in their rates of prescribing.

It will be a busy summer, but by the time the nights start getting longer, the Grief study should have begun producing some research findings. Make sure to check back for more information on what we’ve found.

Posted in Project Methods | Leave a comment

Caring for Carers: The Grief Angle

Since the UK Government’s plans to publish a Care Bill were announced in last week’s Queen’s Speech, there has been more media attention than usual on the work of those who provide unpaid support to ill and disabled family members and others. The bill would give carers legal rights to support from their local council.

One can imagine why protection of carers might be a priority for the current UK administration and to governments internationally. Ever before the Big Society concept was unleashed on us all, carers embodied the idea of a society in which services are exchanged among fellow members of one’s own community, instead of in centralised State institutions. Unpaid or “informal” caring ticks many boxes. The availability of a carer affords a person the dignity of living on in a household environment and of routine interaction with a cherished individual who knows both their needs and their outlook on life. Meanwhile, the exchequer is saved the large cost of paying for shelter and professional care for the person in a formal environment, paying out a modest Caregiver’s Allowance instead. What is more, as the population continues to live longer, a model which allows for the cost of additional years of care to be borne by the citizenry and not the exchequer is good news for those charged with keeping the books balanced. However, the health of the carer themselves is often overlooked when we consider the wisdom of this caring model and creates a cost which may have been missing for some years from the cost-benefit analysis of informal versus formal caring. What if the caring model creates widespread illness among those charged with its delivery?

The tone of the recent debate has very much been set by the call from the Royal College of General Practitioners for more widespread screening of unpaid carers for depression. GPs are witnessing the strain experienced by many carers attending their surgeries and are expressing concern that there may be others out there not receiving adequate treatment and support. The best explanation provided for why carers are at particular risk of poor mental health outcomes is the extent of the burden: carers are often working well in excess of the standard working week with little relief or scope for free time. Additionally, we might imagine that the emotional investment in the role is such that the carer will surely never be fully switched off from their role.

In formulating the Grief Study and identifying particular groups who might be at risk, we decided providers of unpaid care should be a focal group. Death and grief can never be far from the carer’s mind. For many, it will already have begun, with both parties mourning the time when the dependent relationship did not exist and when both were free from illness and suffering. Most couples, most friendships are shielded by the uncertainty of which person will pass away first. If each of us knew the order of our departure, our earthly interactions would surely take on an altogether different character. This ignorance is one which of the carer cannot avail. More often than not, they will be the one who survives, left to grieve the person whom they sought to protect from death, and that room in themselves they inhabited as their entirety. In the mean time though, they live on with the fear and the inevitability parked somewhere out of view.

Death itself changes in its character. People will speak of relief after a long illness, that death comes as a kindness, an end to suffering. A carer may have conflicted and confusing feelings about the prospect of the person for whom they care dying. On the one hand they may wish for the end of suffering, but there may also be strong guilt attached to this and fear of selfish motives fueling these desires. The carer may find it difficult to disentangle thoughts of the person’s mortality from thoughts of how their own life will be when the person is deceased and their role will have ended. Others will avoid confronting this altogether and one suspects these people may be most vulnerable should the cared-for person pass away. Similarly, the thought of one’s own mortality also takes on a different character for the carer than from others. Given the intense dyadic nature of the caring relationship, the carer will surely wonder what person might step in to fill the void they leave.

What is clear is this. We need to talk about carers. Moreover, as citizens, as researchers, we need to talk to carers, to allow them express, and to understand ourselves, the frustrations, the joys, the hows and the whys of the role they perform. For perform they must. With a loved one depending on them, a carer must find a way to look strong and appear masterful and in control. Yet, they do more than perform a role. Some actors speak of inhabiting a role, of living with and as the person they are trying to convey. So it is for carers. The caring role is an extension of their selves and into that extension they move all of their energies.

What is meant by supporting carers? Research on the well-being of members of caring professions consistently point to three key factors in maintaining well-being in care-oriented workplaces, each of which could potentially benefit unpaid carers also. The first two are closely related: good communication and role clarity, i.e., is the person clear on what is expected of them and what their responsibilities are? In the case of an unpaid carer, the nature of the role will be primarily worked out with the person they care. However, much may be left unsaid also, for fear of raising the spectre of the illness, It Which Must Not Be Named. There is little evidence that this is the healthy approach. Communication begets communication and clear and regular contact from GPs, pharmacists and care support workers with the unpaid carer will help that person to define the boundaries of their role and communicate this to the person receiving care. The third critical factor is the level of role-specific training provided to the person. Again this is needed regardless whether one is paid for caring or not.

The welfare of those who find themselves caring for someone close to them is a laudable priority for the Government. However, economic rationale alone will not create the impetus among local councils to provide the support carers need. The unpaid caring population of most western countries equates in size to a very large army. Just as we ensure that soldiers are properly trained and properly supported throughout their service and afterwards, so should we think of our legions of carers. This means devising a rounded approach, central to which is the aim of maximising the health and well-being of all parties during the lifetime of the caring relationship; readying a person for the possibility of a difficult bereavement; and ensuring they themselves are properly supported after their work is completed.

Posted in Uncategorized | Leave a comment

Using Prescriptions as a Proxy of Disease: An Indicator, Not an Indication

Great care must be taken when using prescription data as an indicator of disease.  When diagnosis information is not available prescription data can only be used as an indicator, not an indication.  Accurate definitions of the incidence and prevalence of some diseases in the population are lacking.  For example, understanding the burden of depression and anxiety is notoriously complex, mainly due to the difficulty surrounding the definition of these disorders and in identifying the sufferers.  Depression and anxiety are thought to affect an estimated one in four people in their lifetime with depressive disorders ranked as the third leading contributor to the global burden of disease.1 But there is no population register of depression sufferers and the stigma surrounding mental health means many individuals will not admit to having a disorder.2,3 So how can we study those individual suffering from depression or anxiety?

Surveys can provide a reasonably cost-effective way of gaining insight into the health of the population but they are labour intensive and subject to a variety of biases, the most important of which is responder bias.  Individuals who respond to surveys differ greatly from those who do not respond.  In terms of those characteristics that influence survey participation, evidence suggests that females,4,5 older respondents,4,5 those from higher socioeconomic backgrounds,6 those who are employed,4,6 and those who are married are more likely to consent.6  Many of these characteristics are also associated with better mental health.7-9  A study by Vercambre & Gilbert (2012) found that persons with mental complaints are less likely to respond to surveys, especially if the survey focus is on mental disorder.10

The rating scales of mental ill health within surveys are also subject to a disease threshold value, an arbitrary cut off differentiating a “normal” score from an “abnormal” score.  It is difficult to determine accurate incidence and prevalence rates because the case score identified in one study may not correspond to that used in another.  Even when studies use clinical interviews, what one practitioner diagnoses as depression another may not.

Prevalence estimates based on treated populations, such as psychiatric admissions, often underestimate the true population prevalence as not all individuals with a mental health disorder will be hospitalised.

However, most common mood disorders are treated pharmacologically with antidepressant, anxiolytic and/or hypnotic medication and many researchers are now turning to administrative prescribing data sources for information on population mental health.11-14  Prescription data offers a readily available, affordable, quantifiable, population wide[i] measure of drug utilisation.  The problem with prescribing databases is that most do not contain information on the clinical reason or indication for prescribing.

Does prescription equal illness?

Unfortunately specific drugs do not always equate with specific illnesses. For some prescription medications this is the case.  For example, insulin is prescribed for diabetes and there is a consistent one to one mapping of prescription and disease.  Only individuals with diabetes will receive a prescription for insulin.  The same can be said for anti-obesity medication.  Individuals only receive anti-obesity medication when they are obese, so there is a one to one mapping of disease and disorder.  When considering medications that are indicated for the treatment of more than one disease, the use of prescribing data gets complicated.  The Grief Study will use prescription of an antidepressant, anxiolytic or hypnotic as an indication of mental ill health.  But what implications will this have on our findings?

The mentally well on drugs for mental ill health

Antidepressants, anxiolytics and hypnotics are now used for a wide variety of diseases including chronic pain, fibromyalgia, chronic fatigue, migraine, irritable bowel syndrome, insomnia and eating disorders.15,16 Some would argue all of these disorders are somatisations of mental disorders, but this cannot be assumed for all cases.  GPs feel antidepressants, especially SSRIs, are safe drugs that can be used for many indications and it is believed over-treatment to healthy individuals will have less side effects than under-treatment of those in need.17 Occasionally an individual can receive a “one-off” anti-anxiety prescription for a stressful event or situation such as a job interview or long-haul flight.  This does not mean they suffer from a mental disorder.

The mentally unwell not on drugs for mental ill health

In addition, not all individuals with a mental health problem will be treated pharmacologically.  Individuals who avail of alternative psychotherapy treatments and individuals who receive no treatment at all will be missing from prescription databases.

So when does prescription equal illness? A study by Gardarsdottir et al. (2007) linking prescribing data to primary care data analysed the reasons why people are prescribed antidepressants and developed an algorithm to determine disorder from prescription databases.15  The majority of individuals receiving an antidepressant have a diagnosis of depression.  Those aged less than 60 years were more likely to have a diagnosis of depression alongside a prescription for antidepressants when compared to those aged over 60 years.  Those aged over 60 years were more likely to be prescribed antidepressants for other conditions such as neuropathic pain.  Individuals with more than one prescription for an antidepressant over the study period were also more likely to have an indication of depression in their file.15 Type of antidepressant prescribed is also a potential indicator of depression diagnosis.  The foremost indication for Selective Serotonin Reuptake Inhibitors (SSRIs) is depression.  Gardarsdottir et al. (2007) found that 73%of those individuals on an SSRI had a diagnosis of depression or anxiety whereas another study by Henriksson et al. (2003) found that 82% of those prescribed a SSRI had a diagnosis of depression compared to just 23% of those on tricyclic antidepressant (TCA).  The older drugs are more likely to be used for pain and anxiety disorders (Henriksson et al. 2003; Gardarsdottir et al. 2007).15,18  The more information we have on the individual and prescribing history the more able we will be to identify those most likely to be receiving a drug for possible mental disorder.

Collating prescription data on all individuals who receive antidepressants, anxiolytics and/or hypnotics will inherently include some individuals who are receiving these medications for indications other than mental ill health and exclude some individuals who are suffering from mental ill health but are not receiving pharmacological treatment.  Misclassification bias will affect such a small proportion of individuals in a large population wide prescribing dataset that the only effect it is likely to have on the results is to underestimate the true magnitude of mental ill health in Northern Ireland.

When it comes to identifying a useful tool for the recognition of possible mental disorder in a population-wide cohort, prescribing data is the frontrunner. It’s not perfect. It’s a tool to aid our understanding.  But it’s the best tool we have and an accurate indicator of possible mental ill health.

References

  1. World Health Organisation. Investing in Mental Health. Department of Mental Health and Substance Dependence, Noncommunicable Diseases and Mental Health, World Health Organization, Geneva. 2003
  2. Cochran SV & Rabinowitz FE, Men and depression: Clinical and empirical perspectives. 2000. San Diego, CA: Academic Press
  3. Addis ME & Mahalik JR. Men, masculinity and the contexts of help-seeking. American Psychologist. 2003;58:5–14
  4. Eagan TM, Eide GE, Gulsvik A & Bakke PS. Nonresponse in a community cohort study: Predictors and consequences for exposure-disease associations. J Clin Epidemiology. 2002;55:775-81
  5. Dunn KM, Jordan K, Lacey RJ, Shapley M & Jinks C. Patterns of consent in epidemiologic research: Evidence from over 25,000 responders. Am J Epidemiology. 2004;159(11):1087-94
  6. Shahar E, Folsom AR & Jackson R. The effect of nonresponse on prevalence estimates for a referent population: Insights from a population-based cohort study. Atherosclerosis Risk in Communities (ARIC) Study Investigators. Annals of Epidemiology. 1996;6:498-506
  7. Middleton N, Gunnell D, Whitley E, Dorling D & Frankel S. Secular trends in antidepressant prescribing in the UK, 1975-1998. J Public Health Med. 2001; 23(4): 262-7
  8. Jenkins R, Lewis G, Bebbington P, Brugha T, Farrell M, Gill B et al. The National Psychiatric Morbidity Surveys of Great Britain – initial findings from the Household Survey.  Int Rev Psychiatry. 2003; 15: 29-42
  9. Schoenborn CA. Marital Status and Health: United States, 1999-2002. Advance Data from Vital and Health Statistics. No.351. Hyattsville, Maryland: National Center for Health Statistics. 2004
  10. Vercambre M & Gilbert F. Respondents in an epidemiologic survey had fewer psychotropic prescriptions than nonrespondents: an insight into health-related selection bias using routine health insurance data. Journal of Clinical Epidemiology. 2012; doi:10.1016/j.jclinepi.2012.05.002
  11. NICE CG90: Depression. The treatment and management of depression in adults. The National Institute for Health and Clinical Excellence, NICE clinical guideline 90. 2009
  12. Gardarsdottir H, Egberts A, van Dijk L, Sturkenboom M & Heerdink R. An algorithm to identify antidepressant users with a diagnosis of depression from prescription data. Pharmacoepi & Drug Safety. 2009;18:7-15
  13. Pratt L, Brody DJ, Gu Q. Antidepressant Use in Persons Aged 12 and Over: United States, 2005-2008. NCHS Data Brief. No 76. October 2011
  14. MacDonald TM, McMahon AD, Reid IC, Fenton GW & McDevitt DG. Antidepressant drug use in primary care: a record linkage study in Tayside, Scotland. BMJ. 1996;313:860-1
  15. Gardarsdottir H, Heerdink R, van Dijk L & Egberts A. Indications for antidepressant drug prescribing in general practice in the Netherlands. Journal of Affective Disorders. 2007;98:109-15
  16. Spettell CM, Wall TC, Allison J, Calhoun J, Kobylinski R, Fargason R & Kiefe CI. Identifying physician-recognised depression from administrative data: consequences for quality measurement. Health Serv Res. 2003;38(4): 1081–102
  17. Mercier A, Auger-Aubin I, Lebeau JP, Van Royen P & Peremans L. Understanding the prescription of antidepressants: a qualitative study among French GPs. BMC Family Practice. 2011;12:99
  18. Henriksson S, Boëthius G, Hakansson J, & Isacsson G. indications for and outcome of antidepressant medication in a general population: a prescription database and medical record study in Jämtland county, Sweden, 1995. Acta Psychiatr Scand 2003;108:427-31


[i] In Northern Ireland all individuals registered with a GP are entitled to free-at-the-point-of-service healthcare and free prescriptions.  This means the prescribing database captures all drugs prescribed to the majority of the population (some individuals will opt for private health or will not be registered with a GP but these constitute less than 1% of the population).

Posted in Uncategorized | Leave a comment