
In this study, we are testing the hypothesis that bereavement causes poor mental health. There are lots of confounding factors, but after accounting for these confounders, our hypothesis states that there is still a causal effect. Our study is trying to identify the best estimate of the size of the effect of bereavement on mental health; i.e. does bereavement increase the risk of poor mental health and, if so, is the risk doubled, trebled, or some other value, compared to the risk of mental health for those not bereaved.
In Part 1 of this post, we outlined our understanding of the problem of confounding and gave one example of how a confounding factor, poor physical health, might confound the causal relationship between bereavement and poor mental health and cause an estimate of this effect to be biased. We also explained the use of DAGs (Directed Acyclic Graphs) in the context of identifying confounders.
In this part, we will show you the DAGs we have produced to frame analysis in the Grief Study. We are very keen to receive feedback on these models. If you think we’ve gotten something wrong, if we’ve missed out anything in the diagrams, if we’ve put an arrow in the wrong place, or if there’s anything else that we should include, we’d really like to hear from you, so please send one of us a message, or comment below.
The first variable we needed to deal with was age. Mental health risks vary across the lifespan and risk of being bereaved of someone close to you, such as a spouse, partner or parent, increases steadily as you get older. We decided to group our analyses into three broad age bands “Youth and emerging adulthood”- 16-24; “Working age”- 25-64; “Retirement Age”- 65+. The set of variables identified as confounders is slightly different for each of these groups. For example, while women of working and retirement age are more likely to be bereaved because of the shorter average lifespan of men, we argue that young persons are equally likely to be bereaved regardless of gender. Most bereavement in this group will be of parents or grandparents, gender of the bereaved child doesn’t affect their risk of bereavement.
(As described previously mental health outcomes are available from 2009 onwards. Age groups are derived from the 2001 census, i.e. persons who were 8-16, 17-56 and 57+ in 2001.)
Let’s begin in the middle with the largest group, working population. This is also the group for whom the fullest range of variables is available, as educational attainment and economic activity will not have been collected in 2001 for the youngest and oldest members of the sample.
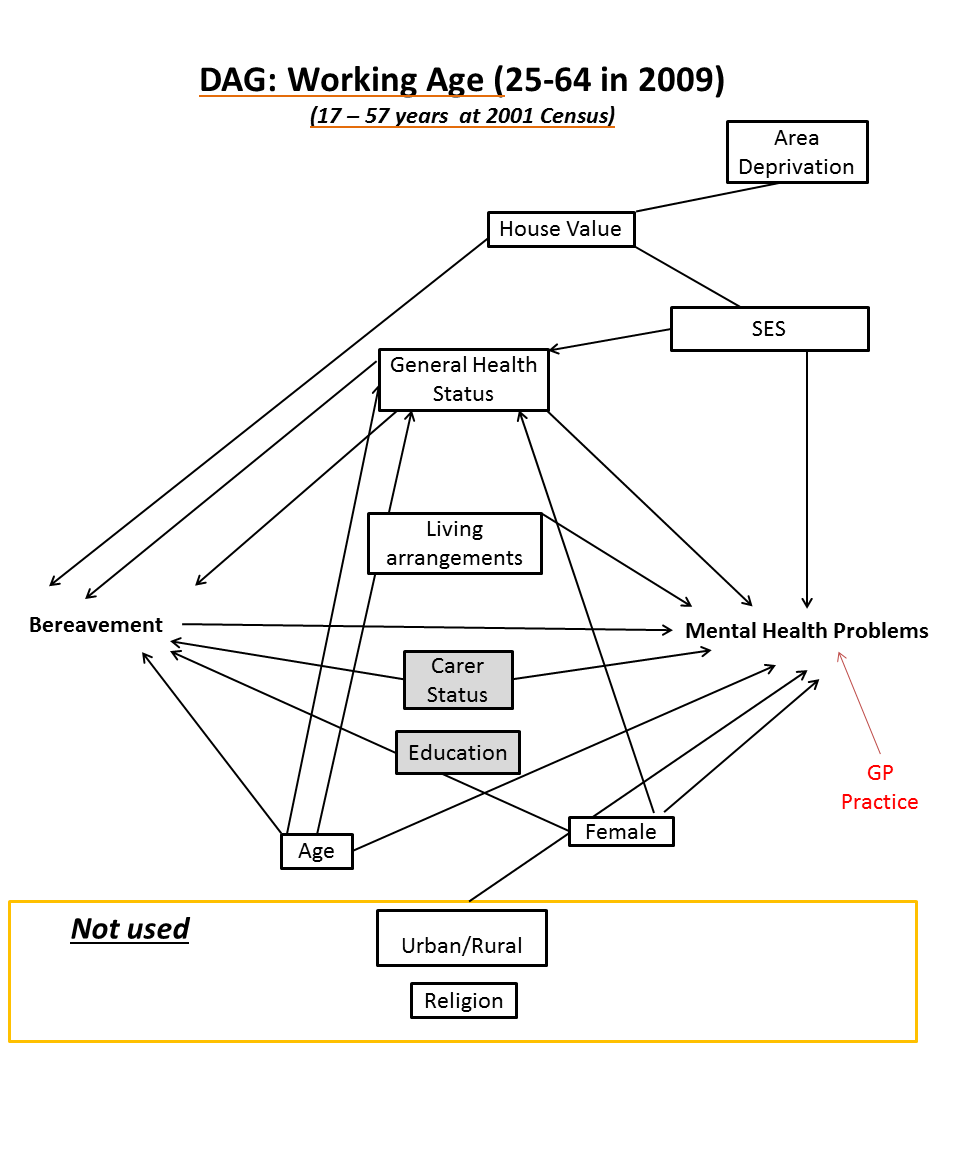
Gender: Women are at increased risk of poor mental health and are also more likely to experience a loss, as men as more likely to die than women.
Age: While models are already stratified by age, being older within this age group continues to contribute to the likelihood both of poor mental health and of being bereaved.
Household composition: The make-up of the household mathematically affects the probability of being bereaved: more co-residents/family members increases the likelihood of bereavement. Household composition and parental marital status also affects children’s mental health.
Individual health is likely to be related to risk of bereavement, as cohort members are likely to experience shared lifestyles and risky behaviours with their co-residents. Congenital conditions will also have familial link. Physical illness is known to be associated with poor mental health regardless of age. Similarly, suffering from a Limiting Long-Term Illness (LLTI) is known to be associated with poor mental health and may an indicator of congenital/prenatal household malaise.
Carer Status: Having to provide unpaid care to a relative may be a risk to an individual’s mental health. Those in caring roles are also likely to be bereaved as this indicates that someone close to them is ill or disabled to the point of dependency. Carer status will be controlled for as a confounder, but further analysis will look more closely at whether having cared for the deceased either intensifies or softens the effect of the person’s death.
Socioeconomic Status: Those at greater levels of deprivation are more likely to suffer bereavement due to lower levels of general health and barriers to resources. The same factors account for worse mental health in deprived households and areas. House value and tenure, Household Car Access and Area-level deprivation are used as indicators for household affluence. We are making the assumption that being in a deprived area causes house value to be lower, and being in a lower value house is an indicator of affluence. House value, access to cars and socioeconomic classification (NSSEC) will be used as individual-level indicators of socioeconomic status which is known to be associated with both risk of bereavement and risk of poor mental health.
Members of different religions have also been shown to have different levels of lifespan expectancy and mental health problems, therefore an indicator of religion is included in the model. Note that religion, education and caring may all moderate the effect of bereavement on mental health (either increasing or reducing the risk of mental health consequences). We will post subsequent blogs on how effect modification can be integrated into our DAG framework.
We omit indicators of urban or rural dwelling on the basis that while this may affect mental health, it is not associated with risk of bereavement.
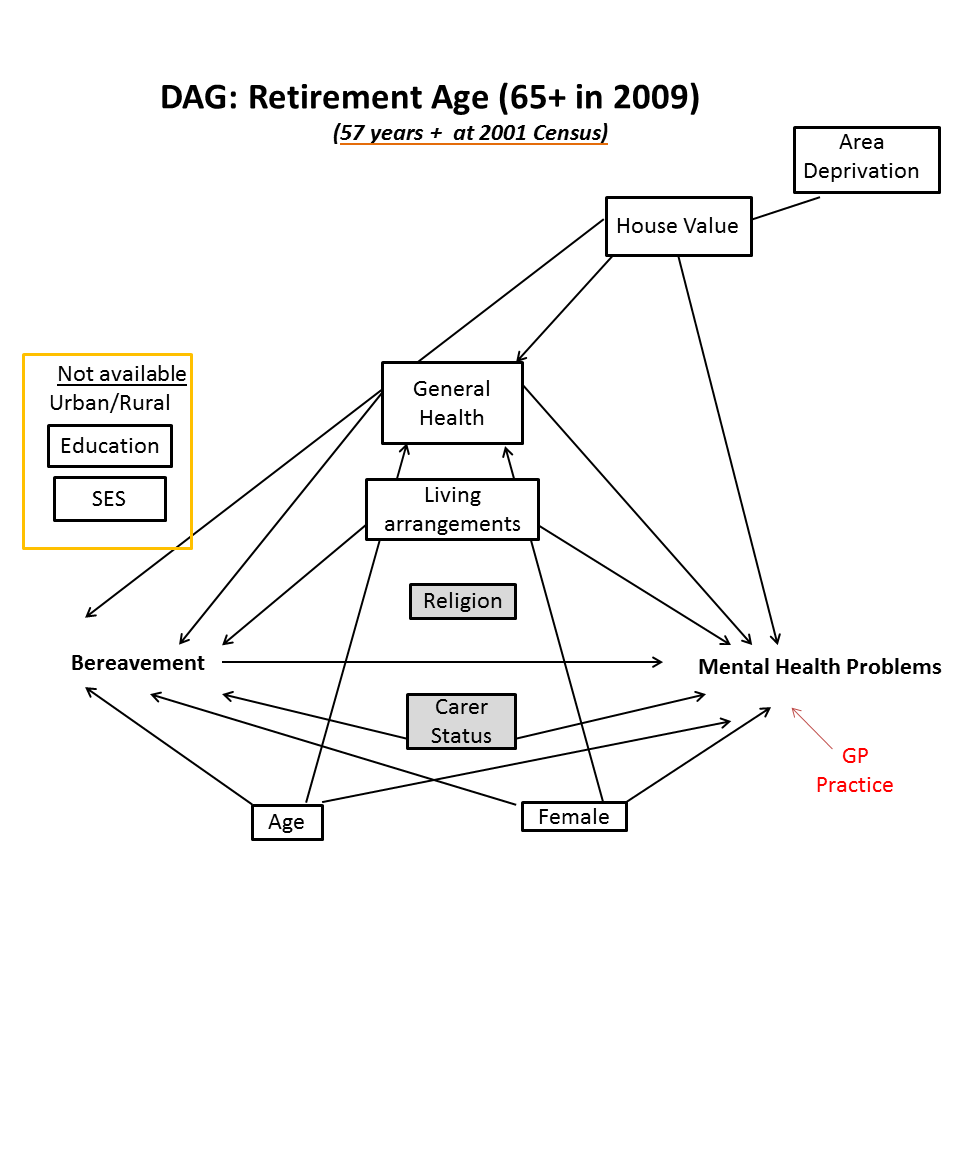
You may recall from our introductory blog that our proxy measure for mental health problems is prescription of antidepressant, anxiolytic or hypnotic drugs by one’s General Practice. GP practice is included in red in these diagrams to highlight that analyses will be clustered to allow for idiosyncratic variation between individual practices.
Generally, the arguments for this group carry across to the retirement age group. The most notable variables included in the working age DAG and excluded from the retirement age DAG are those which are unavailable for the full age range of the sample, namely Education and Socioeconomic Status (for which the NSSEC indicator is derived from job type).
For young people, we suggest that some differences to the model of confounders applied to adults.
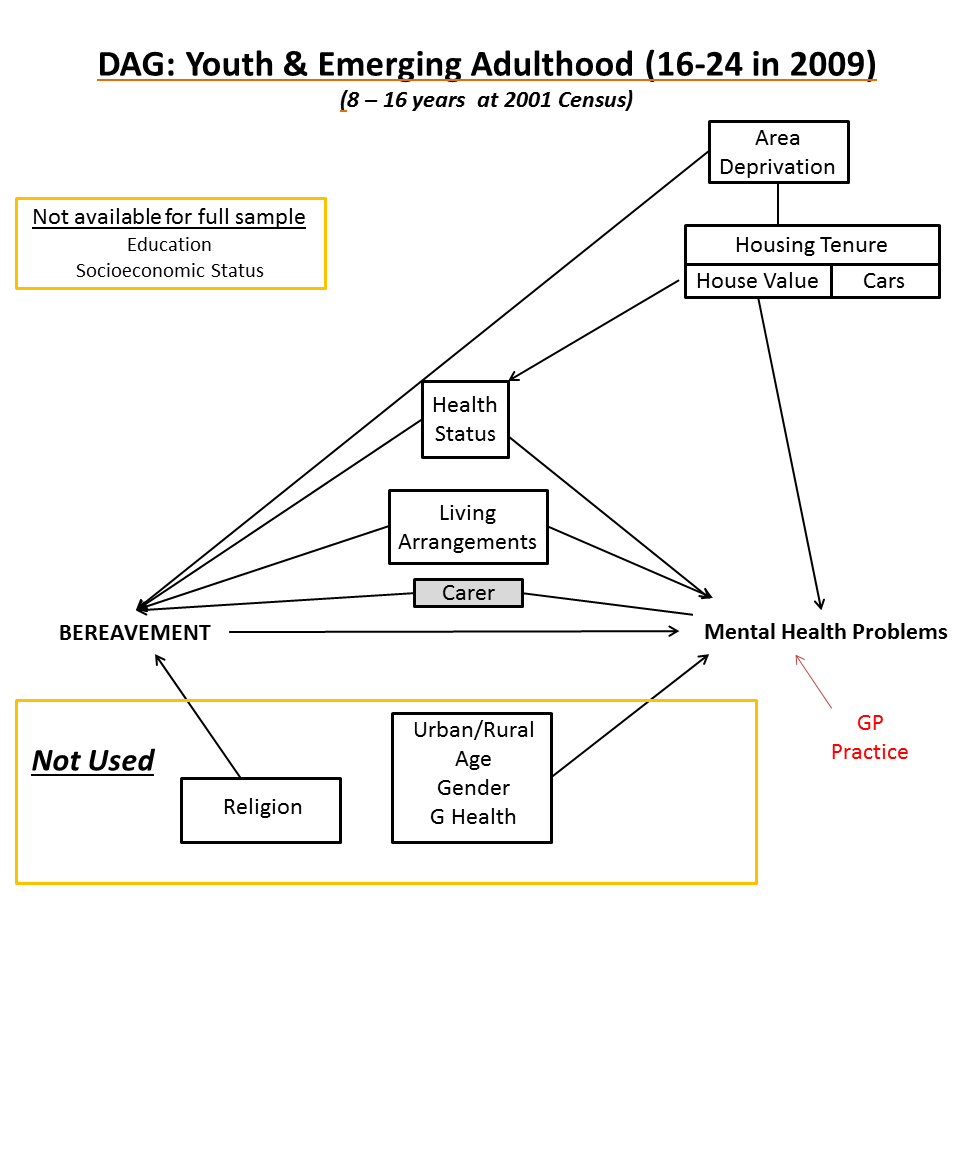
Omitted from this model are gender, age, religion and general health. Young females are no more likely to be bereaved than young males, as the type of bereavement one is most likely to experience as a young person is not of peers but of parents and grandparents. We also submit that likelihood of bereavement varies little between the ages of 16 and 24. Religious differences in bereavement likelihood also apply to lifespan expectancy at older age groups. The census general health question is less likely to be related to risk of bereavement for young people, as cohort members are too young to experience shared lifestyle health with their co-residents.
As stated in the opening of this blog, we are keen to receive feedback on the integrity of these models and whether or not you are convinced by the reasoning for inclusion and omission of variables. We encourage readers to seek more information on Directed Acyclic Graphs and their applications, as we have found them to be tools in the greater toolbox of Quality Thinking; tools which aid clarity of thought and identification of causality. Ultimately we hope that this approach will make our results more accurate, robust and fit for the purpose of informing how we, as a society, help bereaved people to better cope with loss.