
By Quang Vinh Ngo
Energy Network Day 2025
Last week, we, several of the people from RELAX-DN at Chalmers were joining the Energy Network Day 2025, organized by Area of Advance Energy at Chalmers University of Technology. This is where researchers from both academia and industry join together to stay updated and explore new collaboration opportunities in the field of energy. The event includes networking, inspiring examples, knowledge exchange, and a poster exhibition.
Our team presented two research posters at the event. The first titled “Data-driven support for intelligent stream analytics: Energy-efficient processing using summarization”, outlining our theoretical framework for optimizing data pipelines through summarization techniques. The second poster, “Summarization-Based Clustering: A Use Case in Electricity Grid Data” demonstrated practical implementation of these concepts. In our earlier blog post, we have previously discussed the theoretical framework, today we will focus on the practical application of our summarization-based clustering model for electricity grid data analysis.
Context & Motivation
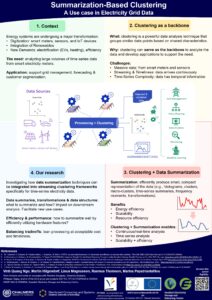
Energy systems are undergoing a profound transformation driven by multiple emerging demands: the integration of variable renewable energy sources to reduce carbon emissions, the rapid electrification of transportation creating new load patterns, and the need for comprehensive grid monitoring to maintain reliability amid these changes. These requirements have catalyzed the deployment of smart metering infrastructure across the energy landscape, which generates continuous streams of consumption data at unprecedented scale and granularity. Analyzing these temporal datasets from smart meters provides valuable insights into usage patterns, consumption behaviors, and anomalies across different time scales. This analytical capability, in turn, empowers utilities and energy providers to improve grid management, enable more accurate forecasting for energy production planning, and support customer segmentation for targeted efficiency programs and personalized services.
However, processing and extracting meaningful insights from continuous, high-volume smart meter data presents significant challenges. Given the real-world example shared by an Energy company that we collaborate with, they manage data from hundreds of thousands of households with smart meters generating continuous readings that must be aggregated and logged every minute to their central data platform. Processing all data points individually creates substantial computational burden, while recomputing analyses whenever new data arrives introduces unnecessary redundancy and processing delays. This is problematic for applications requiring timely insights or the system’s long-term scalability.
Clustering as a backbone
Clustering offers a powerful analysis method as it groups similar data points based on shared characteristics, allowing analysis at an aggregate level rather than point-by-point examination. By serving as a backbone, clustering enables the development of applications that solve grid management needs, consumption forecasting, and customer segmentation with significantly reduced computational complexity.
Nevertheless, traditional clustering algorithms lack native support for continuous data streams and time-series processing, thus limiting their effectiveness. Additionally, since clustering functions as the analytical backbone of these systems, it inevitably becomes a potential frontal processing bottleneck. This requires the ability to compute efficiently and scalability, which conventional clustering approaches often struggle with.
To alleviate these challenges, data summarization offers a compelling way out.
Clustering + Data Summarization
As also mentioned in the previous blog post [LINK], Data Summarization is based on the observation that big data is often very large but also often ephemeral, with the value brought by different pieces of data being uneven. Instead of needing to store, process, and index the entire amount of data, we can extract useful information from massive data sets into synopses data structures, typically requiring much less space and computation. Those algorithms make use of a number of basic algorithmic/mathematical concepts such as histograms, clusters, extracting frequency moments, and various mathematical transformations to produce compact representations of the data.
The direction we are currently exploring for integrating data summarization in clustering to address the aforementioned challenges involves several steps. First, we need to segment continuous data streams into manageable time windows, potentially using sliding or tumbling window approaches. Each window might represent a day’s worth of smart meter readings. Within these windows, we are considering ways to identify what could be called “micro-clusters”—groups of closely related data points with “almost identical” behavior patterns and maintain “feature vectors” (statistical summaries) representing each micro-cluster’s key characteristics. Note that “micro-cluster” differs a lot from “cluster” in common sense. It functions as a data reduction technique where extremely similar data points (like nearly identical consumption patterns) are grouped together, which capture essential characteristics like averages, trends, and variations while requiring significantly less storage than raw data points. In contrast, final clusters represent meaningful analytical groupings that address specific business questions like identifying different customer segments or consumption patterns. These clusters are created by grouping related micro-clusters based on application-specific similarity metrics.
When downstream applications request clustering results, we can process these pre-computed summaries rather than raw data. The grouping methodology would depend on specific requirements such as the chosen similarity metric and time interval of interest. This approach might enable some flexibility for downstream tasks while improving efficiency. The summarized data could potentially support multiple downstream applications with different clustering criteria.
These ideas remain preliminary as we continue to research and refine our approach to streaming data summarization for clustering applications.
Our research
At the DCS @ Chalmers (Distributed Computing & Systems) group, our research focuses on advancing data summarization techniques to enable lean, efficient data pipelines. We investigate optimal data structures and transformation methods that preserve analytical value while minimizing resource consumption. Our work also examines how summarization algorithms can better utilize modern hardware architectures, from multi-core processors to specialized accelerators, to achieve better throughput with less energy expenditure. This theoretical work finds practical application through our collaborations with industrial partners including Volvo Group, Gothenburg Energy, and SESBC (https://www.sesbc.se/), where we apply our summarization techniques to real-world challenges such as support grid management, forecasting & customer segmentation, etc.