By Tommaso Amico
The RELAX network
The RELAX doctoral network, short for Relaxed Semantics Across the Data Analytics Stack, is a EU-funded project that aims to deliver significant research advances in the design of scalable and efficient data-intensive software systems. The network is moving in an inter-disciplinary field marrying data science, data management, distributed computing and computing systems. RELAX has the following main objectives,
- To develop the principles of robust data analytic algorithms in the face of uncertain, inaccurate and/or biased data.
- To develop new algorithms for indexing and summarisation.
- To develop new algorithms and new coordination and synchronisation models to support asynchronous and incremental AI and ML and large data processing for better performance, better freshness and without loss of accuracy, when compared to contemporary barrier-based synchronous approaches that suffer from scalability.
- To develop and organize a bespoke network-wide joint training programme.
- To develop and implement the communication strategy, including social media and web presence, traditional media announcements, identifying and taking part in outreach activities, exploitation of results, managing open source software and open data.
Specifically, the DC9 project deals with the field of eXplainable Artificial Intelligence (XAI). Machine Learning (ML) models are being applied in more and more tasks, including high impact ones.
The black box nature of the ML models prevents them from being trusted and to be evaluated by experts. XAI tries to provide meaningful insights into a given architecture’s inner workings.
The DC9 project also aims to work with data streaming. Current XAI literature mainly focuses on static scenarios and batch learning. Many real-world applications e.g. Internet of Things (IoT), sensor network analysis, social networks and energy consumption prediction require instead dynamic updates. In these scenarios explanations would greatly benefit from being readily updated while the model is learning.
The Grossberg Network and its inspiration
In this blog post we are going to introduce an online vector quantization algorithm called Self-Organizing Map. Like many Arttificial Intelligence (AI) innovations, SOMs take inpiration from biology.
The Grossberg network is a self-organizing continous-time competitive network. Despite being a bit more involved than a Self-Organizing Map, simplifying some of its components and considering discrete updates, we get back a SOM network. The development of the Grossberg network has been heavily influenced by biology and, in particular, by the human visual system.
Grossberg and other researchers used illusions as a pathway to the inner-workings of the visual system. The key idea is that, if we can develop models able to replicate the biological system’s illusions, we will be closer to describe how the visual system works.
Blind spot
Many illusions generate from imperfections of the visual system.
Figure 3, taken from [3], shows the view of the retina, with the optic disk in the middle. The are no rods and cones, which are two fundamental elements for our vision system, in the optic disk creating thus a blind spot. We are not usually aware of the blind spot but a simple test can highlight it.
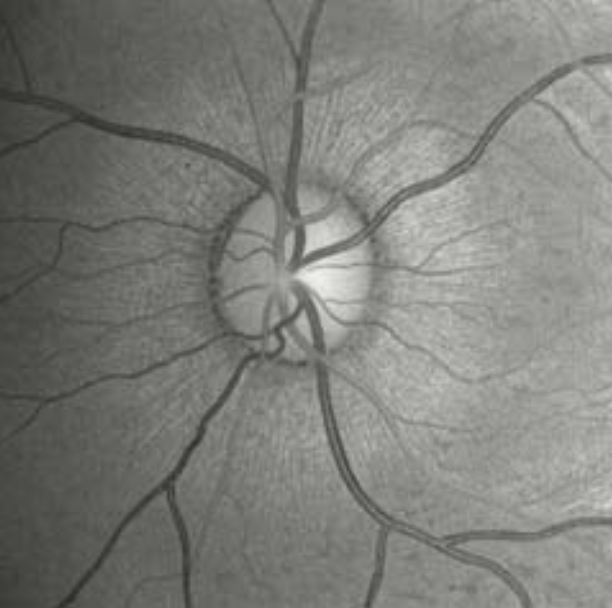
Fig. 3 – Back of the eye with the optic disk, image taken from [3].
We can reveal the blind spot by looking at Figure 4, if we look at the circle on the left, while covering our left eye and then moving our head closer to the screen (or page), we should notice a point where the right circle disappears. Crucially, our brain finds a way to fill the missing region.
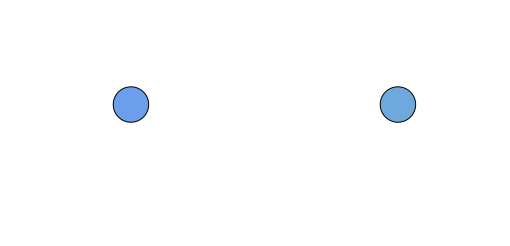
Fig. 4 – Blind spot test.
Emergent segmentation and featural filling-in
Rods and cones, responsible for vision, are sometimes obstructed by arteries and veins, preventing part of the light in the visual field to be received. The reason we don’t notice arteries and veins is that they are fixed to the eyeball and we do not respond to stabilized images (our eyeballs are constantly jerking making fixed objects in the real-world “moving”).
Because the image we get is incomplete, the brain has to compensate. Two of the processes described by Grossberg to achieve this are emergent segmentation and featural filling-in. The former is responsible to retrieve boundaries while the latter fills in color and brightness in the new boundaries as described in Figure 5.
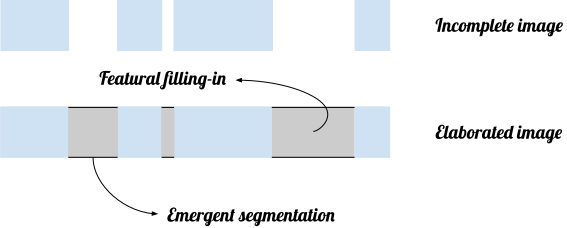
Fig. 5 – Schematic representation of featural filling-in and emergent segmentation.
Many illusions highlight either featural filling-in, emergent segmentation or both. Figure 6 is an example were both are present with a bright circle that should be visible in the middle despite not being there.

Fig. 6 – Example of an illusion were the effects of emergent segmentation and featural filling-in show-up. A bright circle should be spotted on the image despite no change in brightness.
Brightness contrast
The last illusion we are going to present is usually referred to as brightness contrast and is illustrated in Figure 7. Despite the two inner circles having the same brightness, the one surrounded by the darker circle appears brighter. This effect is caused by our vision system being sensitive to relative intensities and is key to let us see in different lighting conditions.
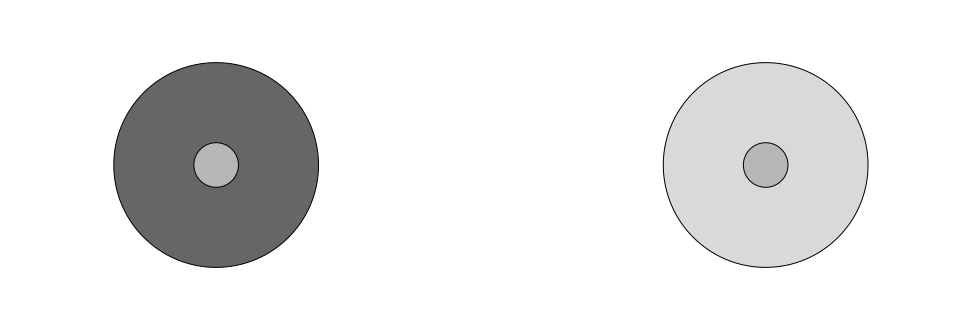
Fig. 7 – Brightness contrast example: the inner circle on the left appears brighter than the one in the right despite the two being identical.
Concluding remarks on the Grossberg network
In its three layers, the Grossberg network, from which we can retrieve a SOM in its simplest form taking discrete updates, implements many of the features of the mammalian vision system we described in the above. It is not thought to replicate the visual system accurately but it efficiently draws from it borrowing from biology to build a competitive network. To understand how brightness contrast, emergent segmentations and the other biological characteristics are mathematically implemented, we refer the interested reader to [4].
Online vector quantization
Data manipulation and processing can prove computationally hard. In several applications, e.g. Internet of Things and wearable devices, computational power is limited and precious. In these domains, an efficient data compression strategy like vector quantization is key.
At its core, vector quantization finds a partition rule dividing the data space in non-overlapping regions characterized by a protoype or centroid as shown in Figure 1.
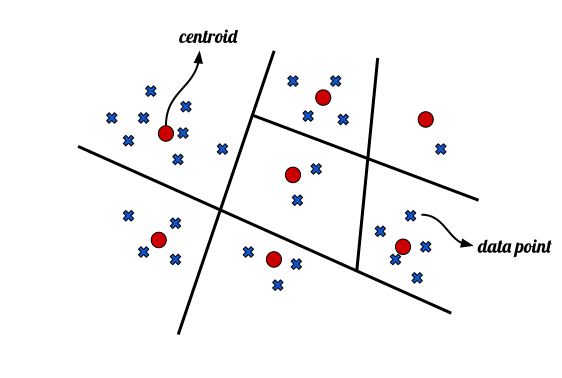
Fig. 1 – Example of data space partition. Each data point (blue crosses) belongs to a region, represented by a centroid (red dots).
If the vector quantization algorithm works properly, we can identify each data point with its centroid without loosing too much information while needing to store just the centroid positions.
In this blog post we are going to talk about a specific vector quantization algorithm, which is also an associative network: the Self-Organizing Map (SOM) network [1]. SOMs were originally introduced by the Finnish computer scientist Teuvo Kohonen, one of the most influential researchers in the field of associative networks.
Associative networks, like many others artificial intelligence developments over the years, find inspiration in biology. Associations and their biological explanations, fundamental for the behaviourist school of psychology, were key in leading Donald Hebb to his classic postulate, summed-up with the catch-phrase “Neurons that fire together, wire together”[6].
SOMs and, more specifically the Grossberg Network, that can be seen as a generalization of SOMs, were deeply inspired by the human brain.
Self-Organizing Map
SOMs are characterised by a fixed set of neurons, arranged on a typically D or 2D lattice. The learning proceeds with data points from the input space x in R being presented to the network and the network then becoming selectively tuned to the input patterns.
Each neuron j has a weight w_j = [ w_(j1), …, w_(jm)]^T which thus lies in the input space. During the learning phase, neurons become ordered resulting in a topographic map of the input patterns. The neurons in the lattice become indicative of statistical features contained in the input patterns.
SOM algorithm
The steps of SOM’s algorithm, while not intuitively being complicated, are deeply rooted in associative and competitive learning principles. Here are the main steps.
- Initialization: The weights of each neuron are randomly initialized.
For each input pattern x = [x_1, …, x_m]^T presented to the network we have 3 main steps:
- Competition: all the neurons in the lattice compete with the one whose weight is closest to the input pattern winning. The index of the winning neuron is thus chosen as i(x) = argmin_j ||x – w_j||
with ||x – w_j|| the Euclidean distance even though other distance metrics can be chosen.
-
Cooperation: Starting form the winning neuron, we locate a neighbourhood of cooperating neurons whose weight will be updated. Many neighbourood functions h_(ij) (with i the index of the winning neuron) can be chosen, e.g. a Gaussian function. h is typically centered on the winning neuron i and decaying smoothly with distance.
-
Adaptation: The weights at step n are updated following the rule,
w_j(n+1) = w_j(n) + eta(n) x h_(i,j)(n)(x – w_j)
with eta(n) the learning rate tuning learning speed.
Figure 2 displays a schematic example of how a 1D SOM algorithm might look like on a 2D space.
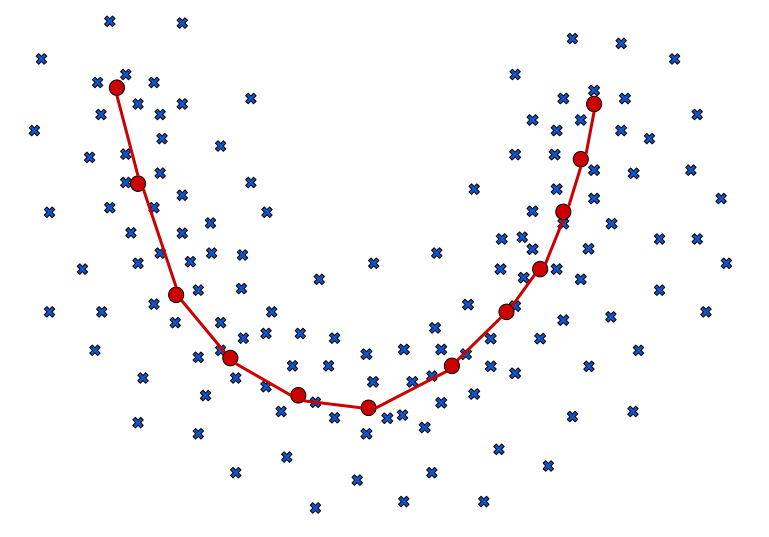
Fig. 2 – Schematic representation of how a 1D SOM example might look like.
Concluding remarks
Self-Organizing Maps have been very influential having several convenient properties like being an unsupervised algorithm. Their discrete updates make it suitable to apply them to an online scenario with each new streaming sample being presented to the network. SOM has also short-comings of course. The most glarying becomes key in the online scenario. Due to concept drift, the data distribution might change and a fixed number of neurons does not fit this scenario. Growing Neural Gases (GNGs) work in this direction allowing for the number of neurons to change while presenting a topology preserving strategy. More on GNGs can be found in [2].
Conclusion
In this blog post we have presented the Self-Organizing Map network, a vector quantization algorithm able to effectively compress data and that can be applied in an online fashion. Artificial Intelligence counts several instances were biology inspired advancement. We have thus reviewed some of the features of the visual system that inspired Grossberg for his network’s design. The SOM part of this blog was largely taken from [5] while the Grossberg network discussion was drawn from [3] as well as the idea for most of the pictures.