


By Nikolaos Andriotis
Although data volume has been the initial challenge behind data-intensive computational technologies, modern datasets often contain errors, conflicting records, missing values and noise. In fact, veracity (data uncertainty) has become a standard V in modern characterizations of Big Data, such that recent frameworks now treat it as one of six core dimensions—alongside volume, variety, velocity, value, and variability[1].
As we aggregate more data from diverse sources, we inevitably introduce ambiguity: sensors give imprecise readings, users provide inconsistent information, integration pipelines create contradictions. For instance, a large dataset can list two different birthdates for the same person or have gaps where a sensor went offline. This data uncertainty – essentially doubt about what the true values are – is a growing issue as datasets scale up in size and complexity.
Many analytics and machine learning workflows still assume data is perfect, even when inconsistencies are obvious. This makes algorithms simpler but can yield poor results. For example, a fraud detection model trained on mislabeled or incomplete data will give poor predictions. In fact, IBM estimates that poor data quality costs the US economy $3.1 trillion per year[2]. Handling uncertainty is therefore essential for trustworthy analytics.
From the perspective of data modeling and management, structured data has given rise to probabilistic databases, where records carry probabilities instead of absolute truths. Similarly, for graph-structured data, uncertainty is modeled with probabilistic (uncertain) graphs, where connections between entities exist only with some probability. These two approaches provide the foundations for reasoning about uncertain information in relational and networked data, respectively, and form the basis of much ongoing research.
The more volume and variety we have, the more veracity problems arise. As a result, data scientists are increasingly looking for ways to incorporate uncertainty into their models, rather than pretending it doesn’t exist. Instead of asking “How can I eliminate uncertainty?”, the new question is “How can I work with uncertain data to still get reliable insights?”
Probabilistic Databases
One solution is a probabilistic database (PDB). A probabilistic database extends the relational database model by allowing uncertainty to be represented. This is done by including a probability with each record to indicate how likely it is to be true[3].
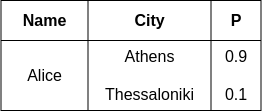

Consider a customer database where a customer’s address is not fully certain – it can be in Athens with 90% probability or Thessaloniki with 10% (because the customer recently moved and records differ). A probabilistic database stores both city values with those probabilities. If you query how many customers are in Athens, the answer is “Alice is in Athens with 0.9 probability.” If you run a more complex query, say counting customers per city, Alice will contribute in both cities with different probability values. Essentially, the database will propagate the uncertainty to query answers
Uncertain Graphs
In a connected world, a lot of our data is naturally modeled as a graph: think social networks, communication networks, transportation routes, knowledge graphs linking facts, and so on. These networks can also be uncertain. An uncertain graph (also called a probabilistic graph) is a graph where each edge (or sometimes each node) is present with some probability. In other words, instead of assuming the link definitely exists, we acknowledge we are only 80% sure that a given connection is real.
Uncertain graphs are increasingly used to represent noisy, real-world networks across domains. For example, in a biological interaction network, an edge can represent a possible protein interaction discovered by an experiment – some interactions are confirmed (100% certain), others are tentative (maybe 50% likely). In a social network, a friendship link can be inferred with some probability from shared contacts.
So what does an uncertain graph look like? You can picture it as a normal graph (nodes and edges) but each edge is labeled with a probability (and possibly each node, if node existence is uncertain).
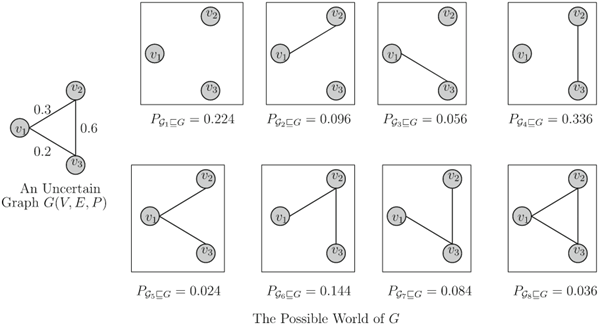

The figure above taken from [4] shows a simple uncertain graph (left) where each edge has an associated probability (the numbers on the connections). On the right side are several possible worlds – i.e. different realizations of the graph that could occur given those probabilities. In one possible world, only a couple of edges appear; in another, more edges are present. Essentially, the uncertain graph represents a distribution over many possible graphs, and each possible graph (world) would materialize if we “flip a coin” for each probabilistic edge. The probabilities on the edges govern how likely each world is. In practice, uncertain graphs allow us to answer questions like: “What is the probability there is a path from node V1 to node V2?”
Possible World Semantics – Power and Cost
Both probabilistic databases and uncertain graph systems rely on the idea of possible world semantics to handle uncertainty. This is a fancy term, but the idea is straightforward: since the data isn’t certain, we must consider all the different ways the data could be. Each “way the data could be” is essentially a possible world – a complete, concrete instance of the data where every uncertainty is resolved one way or another. In possible world semantics, an uncertain dataset defines a whole set of possible worlds, each with an associated probability of being the true.
For a probabilistic database, each possible world is a conventional database instance (no uncertainty left in it). For an uncertain graph, each possible world is a regular graph (some edges present, some not). When you ask a query, the system could iterate through every possible world, compute the query result in that world, and then return a probability-weighted combination of all those results. However, there’s a catch: the number of possible worlds can be astronomically high. An uncertain graph with 10 uncertain edges could have up to 2^10 = 1024 possible realizations.
In practice, researchers have worked out clever techniques to avoid brute-force enumeration Even so, many seemingly simple questions turn out to be #P-hard, a complexity class that is even more daunting than NP-hard. For instance, evaluating a typical SQL join or a graph reachability query on a probabilistic dataset can be #P-hard. As Khan et al. note, classic graph algorithms like computing the shortest path between two nodes become #P-complete when the graph’s edges are uncertain [5].
To put it simply: possible world semantics gives us a clear, rigorous way to model uncertainty, but it makes large-scale analytics incredibly slow if done naively. This is the trade-off in uncertain data management – expressiveness vs. efficiency. This challenge is the focus of my PhD project.
Conclusion
In a world of data-driven decision-making, vast amounts of raw data out there are incomplete or unreliable, and ignoring that fact can lead to errors and missed opportunities. Systems like probabilistic databases and uncertain graphs offer a vision of analytics that doesn’t shy away from ambiguity, but rather quantifies and incorporates it. The ongoing research – including my PhD project – is vital because it tackles the efficiency barrier, bringing us closer to usable uncertainty-aware analytics.